Categories
Uncategorized

How Oklahoma’s Native American community has been disproportionately affected during this pandemic

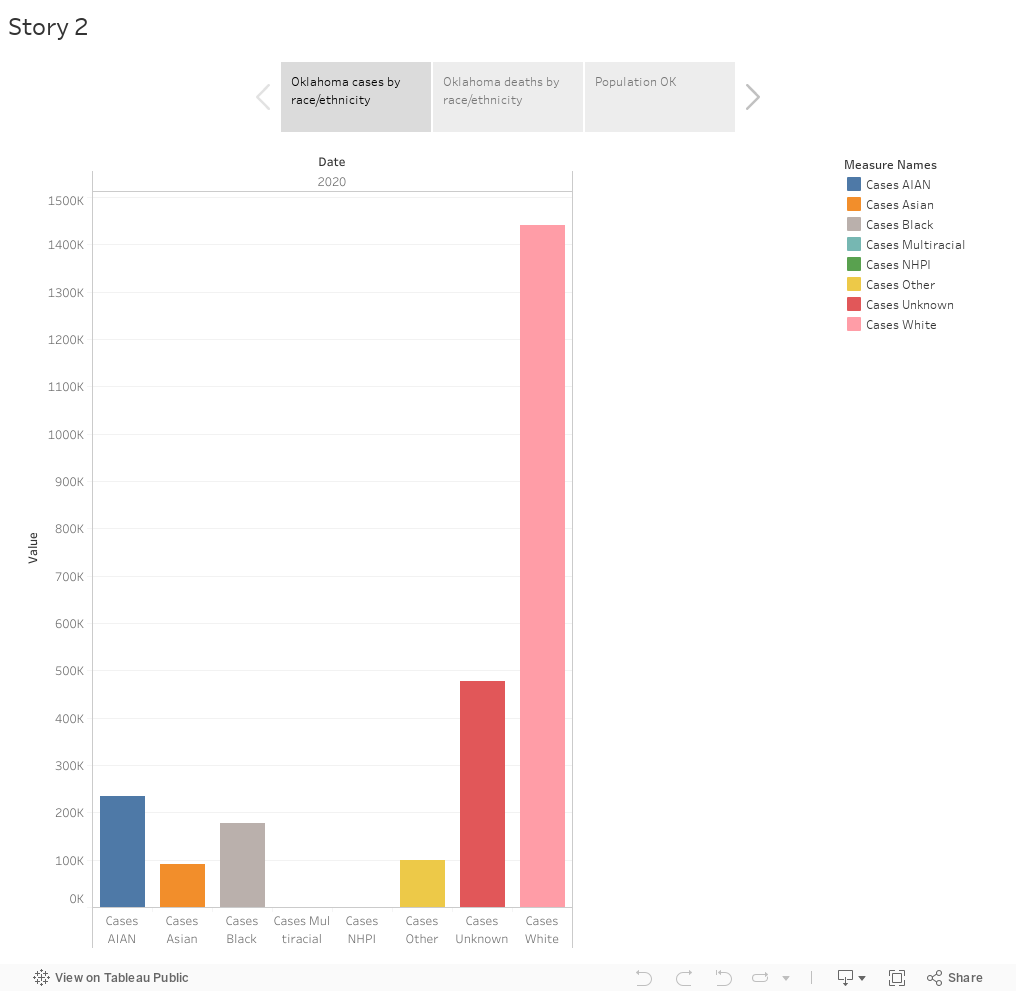
In the United States, minority groups have been struck harder by the novel coronavirus than any other segment of the society. One of those groups are the Native Americans that have faced the worst with this pandemic. According to the Centers for Disease Control and Prevention, Native Americans are 1.8 times more likely to be tested positive for Covid, 4 times likely to be hospitalized and 2.6 times more likely to have died because of Covid-19. Oklahoma is a state with a predominantly white population but also houses a significant Native American population. According to data from the Covid Tracking Project (CTP), Native Americans have been disproportionately affected by Covid-19 both in the number of cases and deaths in Oklahoma.


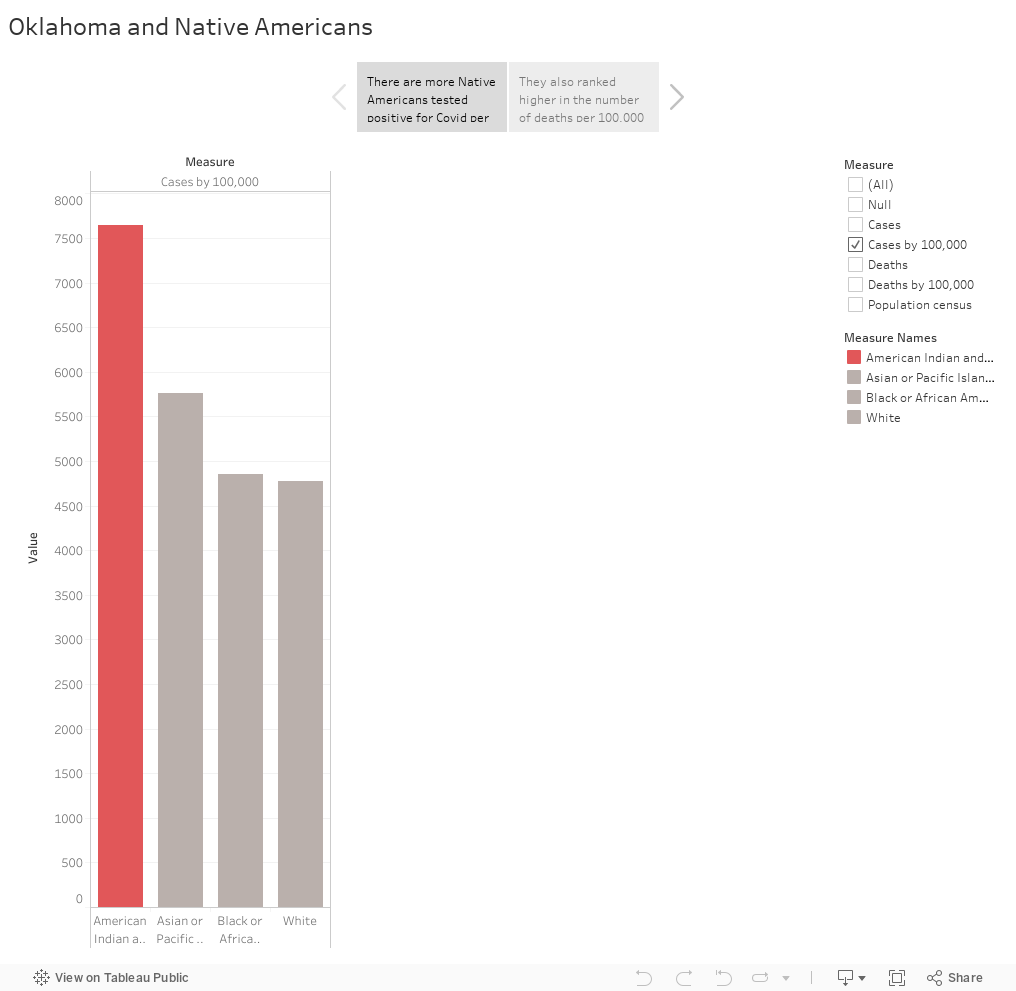
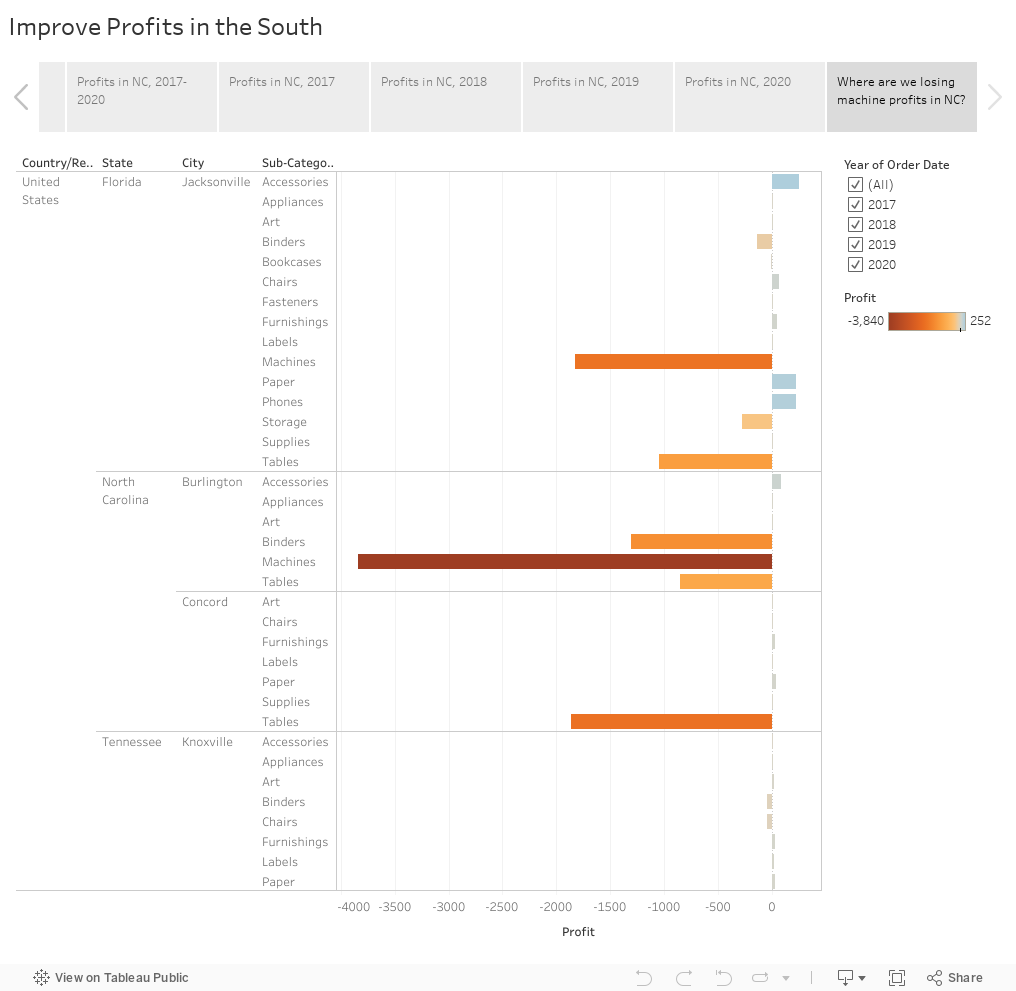
While Native Americans only make about 9% of the total population in Oklahoma, 7,645 per 100,000 cases of Covid-19 come from the Native American community and 61 out of 100,000 deaths are from the community as well. These are the highest numbers out of all racial groups in Oklahoma. Compared to this, 4,778 per 100,000 cases are white individuals, which make about 72% of Oklahoma’s total population, while 52 per 100,000 deaths come from them due to Covid-19.

According to the Indian Health Services (IHS), 31,999 positive cases, the highest in the data, were reported in the Oklahoma City IHS area. Native Americans have had the lower end of health status as compared to other Americans. According to the IHS, the cause of lower life expectancy and disproportionate disease positives could be due to the unfair and unequal social structure in the United States that always puts Native Americans at a disadvantage, whether that’s inadequate healthcare systems, poverty or poor education.

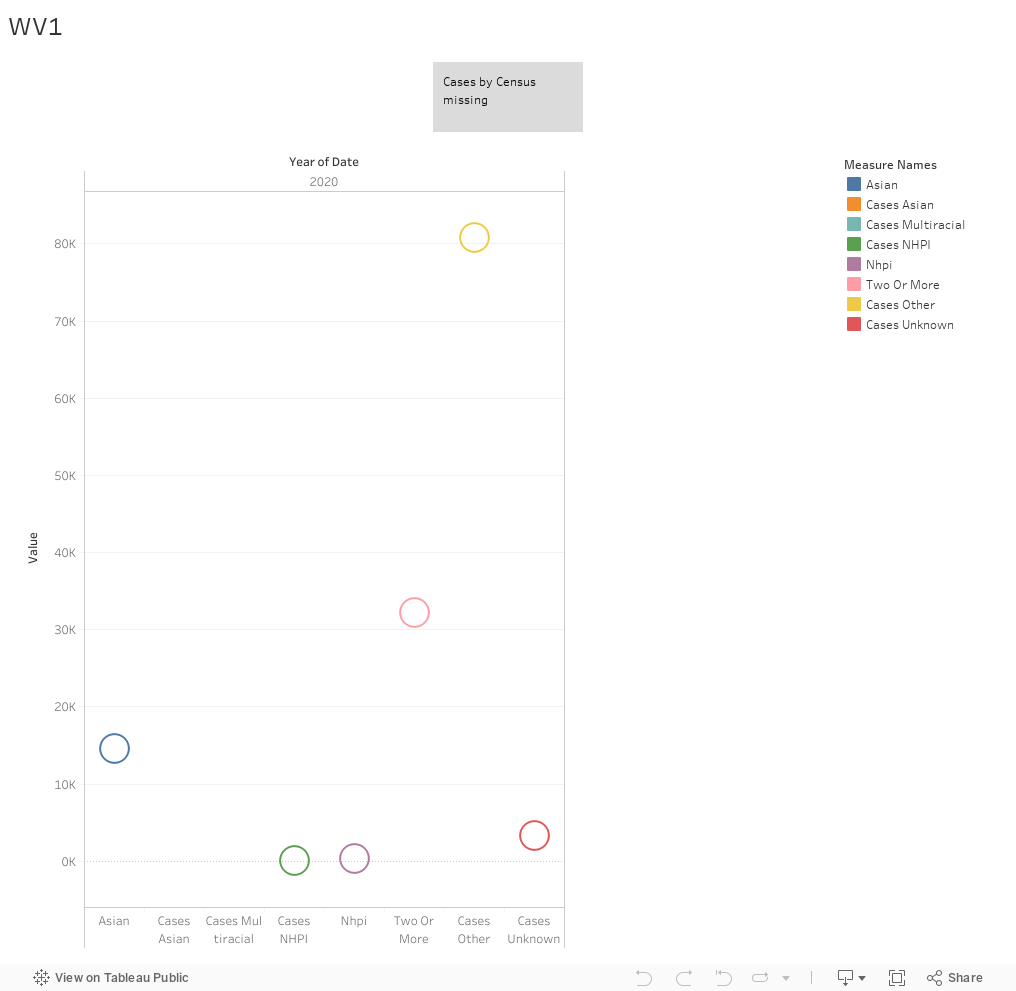
What is alarming though is that despite having a disadvantage in healthcare, Native Americans are usually left missing or undercounted in data.  In most cases, they are grouped together in the “other” section.

In the midst of all this, one tribe in Oklahoma has managed to control Covid cases in their nation, despite the lack of help and support from the state itself. The Cherokee Nation understood the importance of strict actions in order to contain the spread of Covid-19. At the time that the state of Oklahoma took no strict action for a mask mandate and allowed schools to function normally, Cherokee Nation called for strict mask measures and moved schools virtually in order to keep the children and teachers safe.

To help with the recent shift to virtual working and due to poor internet connection in Cherokee Nation, a $3million project will provide internet to citizens to help them during this time, according to KTUL.

Most of their healthcare is funded through their revenue from gaming. This makes a large chunk of total revenue and most of it is now being spent on trying to beat the pandemic. Due to the lockdown, casinos had to be shutdown, while they reopened for a while when measures were made flexible, with limited spaces, point to a bigger question of depleting resources and what is going to happen in the near future.

On December 14, Cherokee Nation announced that the first 975 doses of the Pfizer vaccine had arrived and that distribution would begin this week. Like in most other states, their Phase 1 priority are frontline health workers, first responders, Cherokee speakers, National Treasures and elders.

https://twitter.com/CherokeeNation/status/1338572299100971033

Categories
Uncategorized

Maznah Shehzad’s Revised Pitch

Pitch: One of the things that popped out to me while I looked at the data for West Virginia is how much of it is missing. West Virginia has been reporting COVID cases and deaths for races such as White, Black, Other, Multi-racial. They had reported on Native Hawaiians and American Indians/Alaskan Natives in between but stopped doing so. According do them, this is due to little or no data in those categories. Instead, they have grouped different races into one category called the “Other”.

According to the US Census Bureau, in 2019, WV had 93.1% White population, 3.7% Black, 0.2% American India/Alaskan Native, 0.8% Asian, 0% NHPI, 1.8% multi-racial and 2.4% other races. While the state itself seems to be predominantly white, discounting or aggregating races is an erasure of identity. I want to explore how doing this could have repercussions for the minority groups that are sidelined in the process. I also want to follow the data and see what options patients are given when reporting their race in hospital documents. I also want to ask West Virginia’s health department whether the decision to aggregate races was taken after consulting people from those races or not and why that decision was taken in the first place.

For this, I want to reach out to Abigail Echo-Hawk, director of Urban Indian Health Institute (UIHI) and the chief research officer for the Seattle Indian Health Board, who has been working for the data on indigenous community and fighting to correct racial misclassification. I recently came across her interview for science mag, where she said, “I see being eliminated in the data as an ongoing part of the continuing genocide of American Indians and Alaska Natives. If you eliminate us in the data, we no longer exist.”

For this I would like to talk to:

  1. West Virginia Department of Health and Human Resources
  2. Asian American Advancing Justice
  3. A NHPI, AIAN and Asian from the state
Categories
Uncategorized

Maznah Shehzad Data Sketch 3

Pitch: Oklahoma’s Covid cases disproportionally affect the minorities. American Indian/Alaskan Natives have the highest rate of cases and deaths according to the CTP data. Since Oklahoma is predominantly white as well, it would be interesting to see why minorities are the ones facing the brunt of this pandemic. What are the reasons that differentiate these groups? Is it income? healthcare benefits? community gatherings?

Sources: Oklahoma State Department of Health.

US Census Data for Oklahoma

Payne County Health Department

Words: 650


Categories
Uncategorized

Maznah Shehzad Data Sketch 2

Pitch: This viz shows deaths by race in West Virginia. What is interesting to note here is specifically the month of October. West Virginia is predominantly white so there is no surprise there that the highest death count is coming from them. But it is interesting to note that in the category unknown we see a sudden sharp decrease in October. In the previous months it was increasing suddenly and then in October it dropped to the lowest level when compared to other categories. My biggest question to start with is who is in this category. Then why was there a sharp decrease in October. The sharp increase in deaths for the white community may be due to the nearing of election and the rallies. But I am really interested to know why the unknown category dropped. They haven’t even changed their method to record data so that cannot be the reason.

Sources:

West Virginia Department of Health and Human Resources

Length: 800 words

Categories
Uncategorized

Maznah Shehzad Data Sketch 1

Pitch: West Virginia has a very simple set up for a complicated population. Even though according to the census, white is the most prominent race in the state, it is necessary to count other races as well given that they are a minority there. One of the things in the data that seemed interesting was how WV started to count Native Hawaiian Pacific Islander cases and then stopped and grouped them with “Others”. Similarly American Indians faced the same fate. Asians, NHPI, AI and all other races that aren’t Black and White go into either other or unknown. One of the reasons in the CTP data states that because of small or no numbers, they decided to aggregate it. But then why did they start counting NHPI in the middle and stopped and also NHPI is a smaller portion of the total population compared to Asians in the census. Why weren’t Asians counted separately then? Why is it grouped together?

Sources:

West Virginia Department of Health and Human Resources

Census Data West Virginia

Asian American Advancing Justice

Length: 800 words


Categories
Uncategorized

Maznah’s Covid Tracking Project Shift

On October 25th, I did my first volunteer shift for the Covid Tracking Project. I helped them with data entries for their afternoon shift. While I had observed a shift a day earlier and also had some practice of what to do, I was still feeling a bit nervous. I took my time reading the instructions and kept tabs on slack the whole time in order to not miss any messages that come my way.

We started with check-ins, which is always fun and then the Shift Lead (Sonya Bahar) asked us to start. I did a total of seven states that included CT, GA, IL, MP, NC, PR and WA. North Carolina perhaps was the most difficult one, because it used Long Formulas that I hadn’t done before. I followed instructions to the exact point and managed to get the correct number. Even though I was worried initially, I didn’t realize I was zooming past states while doing them. Amanda was right, it was really fun!

A lot of the states don’t update on weekends, that’s always stated in the process notes. But you still have to double check and report that they weren’t updated. Similarly for MP, I had observed a shift earlier and found out that they hadn’t been updating their numbers for some time and during my shift, it was the same case, we had to note that down on Slack so someone can keep tabs on it.

I did have an interesting incident where I was updating numbers for Washington and right after I had finished, they updated their numbers on the dashboard. Amanda was super helpful and explained that this happens sometimes and less likely now that they have the “check next” feature but still sometimes this can happen.

I found the Slack coordination to be really helpful because if I faced any problem, I would post it in Slack and immediately get guidance from Double Checkers and the Shift Lead. It is amazing how the Covid Tracking Project has managed to define every single thing to the point that a newcomer can understand exactly where to go to find data just by following instructions. At first, it may seem complicated but it was actually interesting and also fun.

While working with all of these talented individuals, I felt like a part of the team. They were so encouraging and appreciative during the shift and always took out the time to explain the errors made and how to correct them. It felt very welcoming and I would love to volunteer for another shift because of this experience. This time I’d want to try my hand at more complicated states too.

Categories
Uncategorized

Maznah’s Tableau

Categories
Uncategorized

Maznah’s Timeline