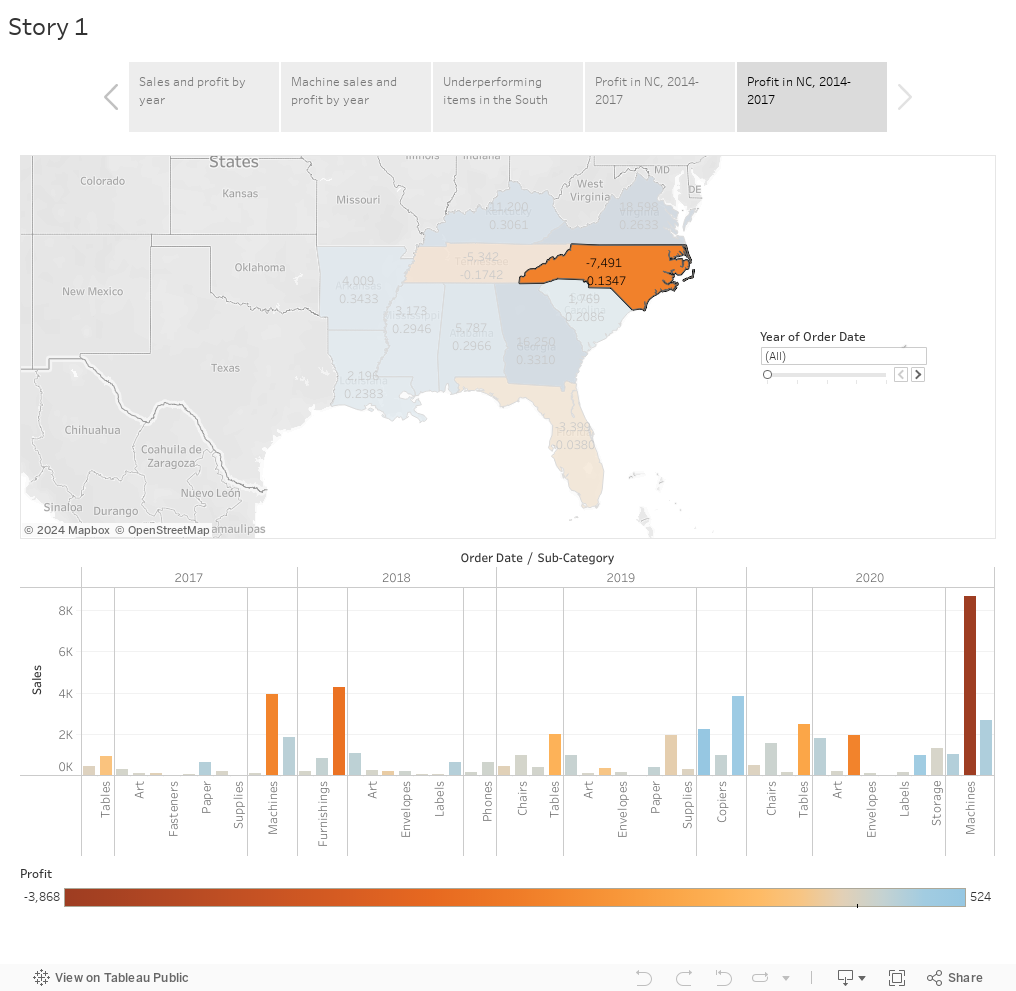
I actually had trouble completing the tutorial; followed the instructions, but couldn’t get past this step.
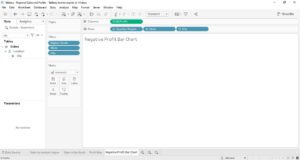
I actually had trouble completing the tutorial; followed the instructions, but couldn’t get past this step.
Before working with the COVID Tracking Project, I didn’t realize how much painstaking work went into collecting the kind of data that I often take for granted. When reading news stories about COVID-19 — or, for that matter, about any topic that incorporates data — I’ve never really questioned how data is collected and analyzed to determine trends. But crucial concepts such as the idea of a certain area seeing a “spike” in COVID cases, and the way this is reported in the news media and subsequently responded to by governments and the public, have their basis in the human work of gathering information day by day and comparing it to values from previous days or other locations.
These numbers come to the public (and journalists who write stories using them) ready-made, but the work put in every day at the COVID Tracking Project illustrates how much thought and effort has to go into getting them there. I came away from my shift feeling extremely impressed and awed, not only at the complexity of the task but at the fact that so many people volunteer their time to help. In these truly bleak and difficult times, I was heartened by the way people came together to make this happen.
At the same time, I was struck by the necessity of the project in the first place — that journalists are doing this because the federal government cannot be trusted to accurately report COVID information (or had refused to do so in the past). Even now, after the CDC began reporting state-by-state figures, they often don’t match up with what the COVID Tracking Project found, for unknown reasons. This is a clear demonstration of the importance of journalism as the fourth pillar of democracy and a necessary check on government (especially a government that is openly hostile to silence), and which may try to mislead the public about the reality of COVID-19 infections if not challenged.
Working my shift also allowed me to apply some of the concepts we previously discussed in class, including the limitations of data collection. We could only put in what the state health departments themselves were reporting, and many categories were left blank if a state did not report antibody tests, for example. Furthermore, those state health departments were themselves limited by county health departments, which were limited by who came in to take a test. Thinking this way made the prospect of accurately counting COVID-19 infections and deaths in the US seem even more daunting, but the project at least did what it could with the information it had available.
During my data shift, I was responsible for gathering data from five states: NY, MD, AL, KS, and OR. I think the biggest thing I’ve learned is how PRESENT, really, with capital letters, you must be in the moment to do this job. It seems easy since there are so many notes about what to do and where to look for information, but it can be very deceiving if you are not really paying 100% attention. There are so many categories with similar names; it’s easy to get confused and make a mistake. There also categories where you need to make calculations and those are especially deceiving in my opinion — since you can’t type, you really have to rely on yourself to write things correctly and avoid any typos.
By the way, another thing I learned is the importance of not copy-pasting data or using the schedule function to type dates/times — in this case, at least. Amanda French explained to me that they run a lot of programs in the sheet, so you can’t really copy-paste anything or use the schedule function. That was interesting to know.
Also, I touched on that briefly already but I’m impressed with the level of organization of that spreadsheet; it makes everything a lot easier for us checkers. There are easy instructions on where to look for each data and warnings about what can happen. It looks like they already foresaw for you everything that can go wrong and what do about it. I guess that is the only way of making a huge project like this run smoothly.
Another thing that I noted is the sense of community of this whole project. Yes, we are dealing with numbers and working from different places, but during my shift, I actually felt a very strong sense of community and it almost felt as if we were all working together in the same office. Slack works really well in this case, because it’s also organized and people are actually paying attention to it, answering fast to any questions checkers may have. I believe that sense of community is always important, but even more when we are dealing with such a harsh subject — yes, we are discussing numbers, but if we stop to think that each of these numbers is a person, it gets very, very sad and uncomfortable. So it’s nice to have this sense of community and people to talk with during the shift. I think they are doing a great job and that’s why people keep going back to take more turns.

For my data entry shift, I collected/checked data on Oregon, Texas, Idaho, New Hampshire and Arizona. It was amazing to see the great team work and the organization these folks have. When I was involved in a massive data gathering project at my prior job, there was no collaboration whatsoever, and I had the sole responsibility of updating the data of multiple departments. It is a huge company with thousands of assets throughout the country.
Looking back, I wish my department could have used Slack or a similar channel to make all departments accountable for updating their portion of the data. The project was usually a mess because I would get a gazillion spreadsheets from different people, and would have to manually enter the info vs. having a single place where everyone could do their own data entry. Timing of deliverables also varied widely across departments, so using Slack and a “date” column would have been great to know the overall timing of the project.
Data entry is usually a hassle, but seeing the collaboration and constant communication definitely made it more bearable. I also felt I was part of a team and that incentivized me to do my best. On the downside, it was a sad to see states where hospitalizations and deaths increased. When you’re checking and entering the data, you only see numbers, but it hits you that these are actually people going through an awful virus or people who passed and left families behind. Also, it shows the complexity of tracking the pandemic in such a huge country with so many states that each report the information their own way. The website layout and how the data was categorized varies widely from state to state. It is smart to track in the notes the quirks and idiosyncrasies of each state so the person in the next shift knows what to expect.
Now I understand these types of projects can’t be a one-man job. I admire the commitment the journalists at The Atlantic have, and their understanding that it is in everyone’s best interest to collect and report all this information.