Categories
Uncategorized

Bessie Liu’s Revised Pitch

Pitch

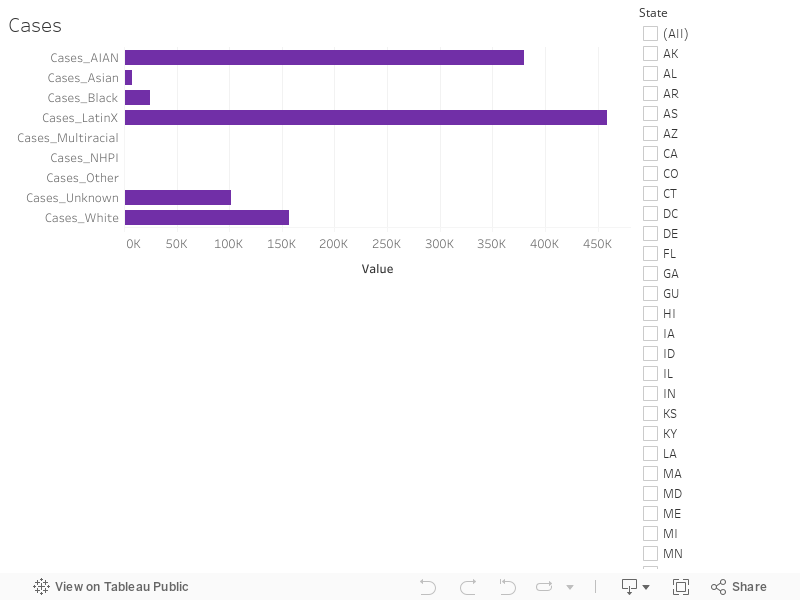
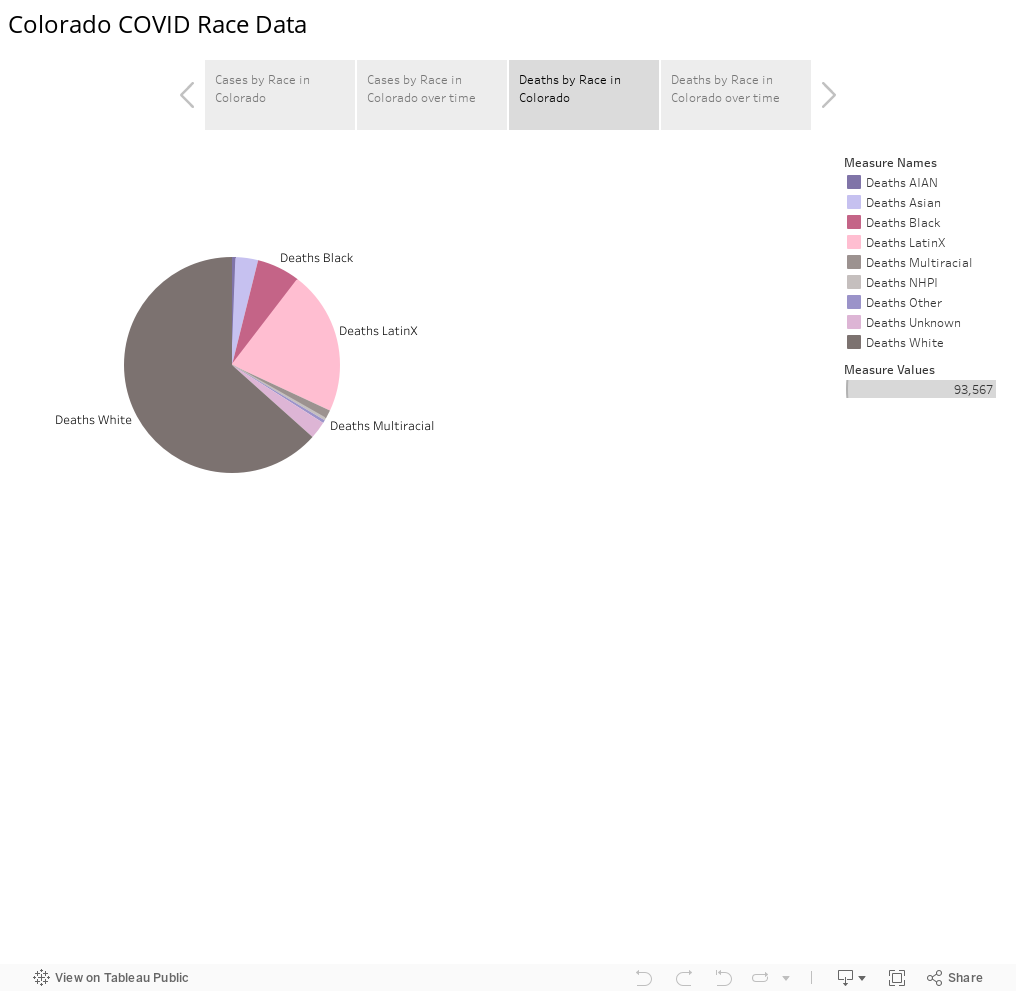
COVID 19 cases in Colorado seem to have disproportionately affected Latinx communities – especially when related back to the population per capita. Latinx people make up only 21% of the entire population in Colorado.

A possible reason that this is the case is that Latinx people tend to live in households with multiple people. Further, populations which usually have a lower median household income, or live in communities which may not have reliable access to healthcare, are also more likely to be affected by the coronavirus.

According to the Latino Leadership Institute, the median age of Latinos in Colorado is 27 compared to 42 for non-Hispanic whites, an age significantly younger and supposedly less susceptible to suffering serious COVID-19 consequences.

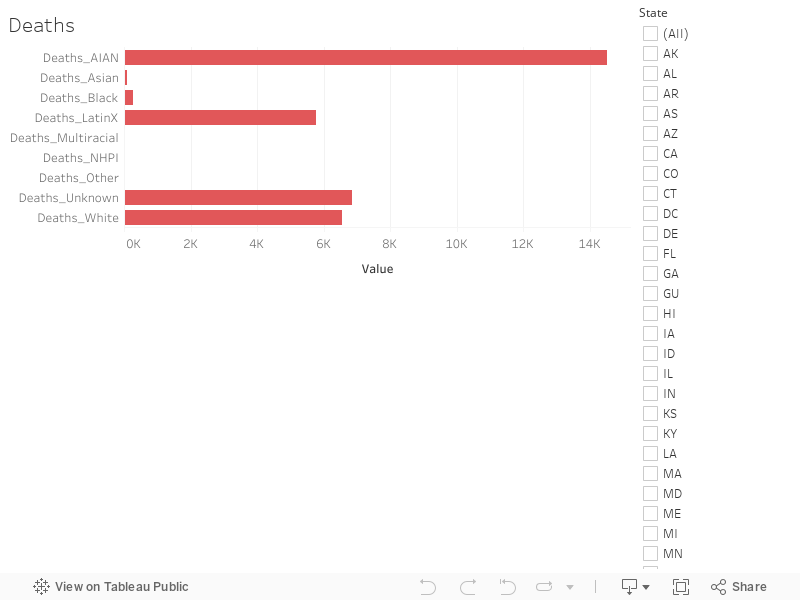
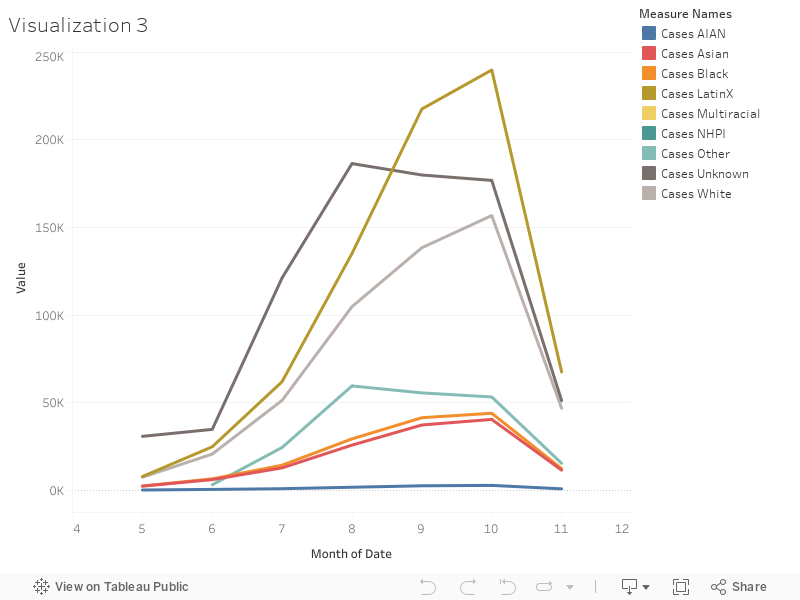
I would examine why COVID-19 has infected such a large amount of people in the Latinx community in Colorado, and examine how many cases translated into deaths, and how many people recovered.

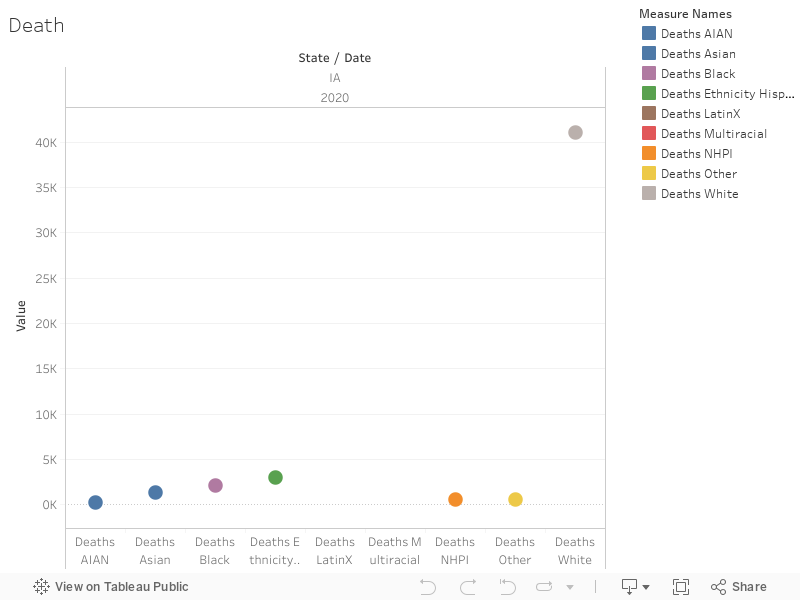
I would also examine the age of the people who have died to see if it is mainly with an older population, or if a younger Latinx population is also being affected.  I am curious about how the virus may have been transmitted – is it work-related or the larger families? – Would look at wage data and the total number of people in the household.

Categories
Uncategorized

Catarina Moura Data Sketch 2

Number of cases and deaths by Enthnicity in New Mexico

Pitch 

There’s a few things I’d want to look into in terms of number of cases and number of deaths by ethnicity in New Mexico. I would want to understand, first of all, why about a third of all cases (both in the state and the US overall) are unknown. For this I would get in contact with the Department of Health and try to understand how they’re collecting their data. And then I would like to look into something else. In the US 18.5% of the population identifies as Hispanic or Latino, according to the US Census Bereau. That number is 49.3% in New Mexico. There’s a big contrast in the overall US numbers in terms of Hispanic cases (more than a third), but in New Mexico, the percentage of Hispanic cases is actually lower than the percentage of Hispanic residents. I would want to understand why New Mexico apparently doesn’t follow what seems to be the overall trend in the US, when it comes to the relation between population vs. number of cases.

Sources

Sources

New Mexico Department of Health

Census Data from New Mexico

Meghan Brett, Associate Professor, Infection Diseases at University of New Mexico

Length: 800 words

Categories
Uncategorized

Catarina Moura Data Sketch 1

Number of Cases and Deaths by Race in New Mexico

Pitch

Comparing the number of cases by race to the number of deaths by race in New Mexico, there are clear differences in terms of percentages. I would want to look into what possible reasons might justify these discrepancies. Why are LatinX people number one in the number of cases, but then AIAN people not only are number one in deaths, but more than double LatinX people? Is there a reason more AIAN people are dying porportionaly?

Sources

New Mexico Department of Health

Census Data from New Mexico

Meghan Brett, Associate Professor, Infection Diseases at University of New Mexico

Length: 800 words

Categories
Uncategorized

Sydney’s Revised Pitch

In the state of Mississippi, the highest death toll has been amongst minority groups. Specifically, amongst African-Americans and Latinos. But in recent months, the death toll has reached its highest amongst white people in the state of Mississippi. According to CNN News, the death toll amongst whites became the highest in October, while black deaths became the second highest. This is a great difference because at the beginning of the pandemic Black Mississippians accounted for about 60% of COVID-19 deaths and cases.

There could be many reasons for this but state officials of Mississippi say that while many minority groups have started to social distance more and maintain mask wearing, white Mississippians have not been paying as much attention to safety protocols.

“As far as the case trends, we have had really pretty good uptake by a lot of folks in the Black community with masking and social distancing,” state health officer Dr. Thomas Dobbs told CNN reporters in October. He said that he noticed more COVID outbreaks amongst the counties with a majority of white people.

“It may well be we’ve found a pretty receptive audience in the African American community, and it may well be because they were hit so hard and have personal experience. But we’re not having the same success we’ve seen with other segments of the population.” Dobbs said in regards to the Black community of Mississippi.

I would like to use this research and analyze why COVID-19 is increasing amongst white people in Mississippi. I’d like to interview health experts and professors from Mississippi on mask wearing, social distancing, and the habits of white communities in this state and contrast it with minority communities. I’d like to see why the highest deaths and cases have switched to the white population. I’d also like to see if this has anything to do with their political affiliation, and their trust or distrust of Governor Tate Reeves.

Sources:

Girmay Berhie, dean of Jackson State University’s College of Health Sciences and School of Public Health

Doctor Thomas Dobbs, State Health Officer of Mississippi

Mississippi State Health Department, msdh.ms.gov/msdhsite/_static/14,0,420.html

cnn.com/2020/10/23/health/mississippi-coronavirus/index.html

mississippitoday.org/2020/04/08/black-mississippians-at-greater-risk-72-of-deaths-56-of-states-covid-19-cases/

Categories
Uncategorized

Shelly’s Revised Pitch

Pitch:

In Iowa, according to the COVID Tracking Project Racial Data Dashboard, Black Iowans comprise about 4% of the state population but 11% of COVID-19 cases and 5% of COVID-19 deaths in the state. Asians, as well, have a very similar case numbers in Iowa, and the highest death numbers, which I don’t see a lot of reporting. I want to look into the reasons behind why Asian community is suffering from Covid-19 in Iowa. What factors are in play to account for such a difference? And how can health care providers work to address these disparities?

Potential sources:

  1. University of Iowa Health Care has a “Diversity, Equity and Inclusion Task Force” to help with racial disparity and the reasons behind it.
  2. Iowa Department of Health Services focuses on ensuring the safety and well-being of their healthcare team and those we serve during the COVID-19 pandemic.
  3. Several stories on Asian Iowans see increased xenophobia, harassment during coronavirus pandemic. I could reach out to the publications.
Categories
Uncategorized

Maureen Mullarkey Revised Pitch

Comparing Covid Race Data with Presidential 2020 Voting Data

Nevada was not only a swing state in the 2020 Presidential Election, but one which kept the country waiting for electoral college votes. I want to compare voting data by counties and compare them with covid race data.

50% of Nevada is white and 28 % Hispanic or Latino. While whites made up 31% of COVID-19 cases, Hispanic or Latino residents made up 48%. And in the summer, positive cases for Latinx people increased at an all time high, at 239,889 recorded cases.

For a story, I would like to investigate why there was such a drastic increase in the summer months, and why it is at an all time high as of this month. Also, when looking at a map of counties, most counties voted red. What turned Nevada blue was its smaller, yet more populated blue counties. Many Latinx communities live and work in these counties. I would love to do a comparison of each county’s votes compared to how they were hit by COVID-19, to see if the virus influenced or did not influence their votes.

Categories
Uncategorized

Shelly Data Sketch 2


In this data visualization, I was focusing on the death numbers from Covid19, by each racial group. I found out that among all the known cases and known races, the death numbers among the hispanic community is the highest. There are reports on racial disparity among the hispanic group in Iowa. However, there are not much reporting on the reasons behind such disparity. I want to look into why the there are no reporting and investigation yet.

Categories
Uncategorized

Shelly Data Sketch 1


Pitch one:

From this data visualization, I found out that the case numbers among Asians and Black communities are almost equal, which is a little surprising to me, because from all the reportings, not many are mentioning the Asian racial group. I want to look into why that number is being underreported.

Categories
Uncategorized

Serafina Smith Revised Pitch

Tracking Race Over Time in Hawaii

In this graph of Covid cases in Hawaii over time, two things are immediately visible: Hawaii experienced a major spike in cases in late July/August, and that for the majority of those cases, the race of patients is unknown. In this story, I will investigate the missing data. A story by the nonprofit news site Honolulu Civil Beat speculated that this lack of data is caused by overwhelmed investigators during this surge. I will investigate how this could have happened, and why they haven’t been able to catch up despite a plateau in the number of “unknown” and total cases around the end of September.

Hawaii ranks as the most racially diverse state in the US, and its racial makeup is much different than the mainland. It is the only state where white people make up less than a plurality of the population, and almost a quarter (24%) of Hawaiians are multiracial. In the Covid data where race was collected, Native Hawaiians and Pacific Islanders make up a disproportionately large number of Hawaii’s covid cases. In this story I will investigate if the “unknown” cases also account for a spike in the proportion of Native Hawaiian and Pacific Islander cases, or if perhaps another racial group has been underreported.

I have contacted and am waiting to hear back about interviews with several sources. My plan is to investigate the chain of custody for this data from the hospital to when it is reported on the state’s website, and therefore included in the CTP data. I am working on speaking with one of the major hospitals, such as The Queen’s Medical Center or the Kapi’olani Medical Center for Women and Children, to learn me more about how they keep track of data and report it to the state. I have also contacted Janice Obuko, the public information officer for the Hawaii Department of Health, who I hope will be able to tell me more about how covid race data is reported to the state agency. I have also contacted the Hawaii Data Collaborative, a group which compiles state-level data on several topics, for more context about how data is collected in Hawaii and hopefully local knowledge about who to talk to to find this missing data. I am also hoping to find an epidemiologist and/or data scientist with the Hawaii Department of Health.

Categories
Uncategorized

Elli Garcia | Revised Pitch

PITCH
Montana COVID-19 infections are disproportionately impacting the American Indian / Alaska Native (AIAN) population. The AIAN community makes up only 6% of the population, yet make up a much higher proportion of COVID cases and deaths, 19% and 38% respectively. The current surge in COVID cases is driven by Yellowstone County, leading the surge with 8.8K or 20% of cumulative confirmed cases in the state (11/14/20).

Although the AIAN community only makes up 4.8% of the population in Yellowstone county, the neighboring county, Big Horn County, is home to the most AIAN residents as 66% of the county’s population identifies as AIAN. Yellowstone county is located next to Big Horn county, which has the highest AIAN population in the state, more specifically home to the Crow Nation. I would like to pitch a story that investigates the surge in Yellowstone cases as they relate AIAN populations around the area, particularly in Big Horn and Glacier, and Rosebud counties which have some of the highest cases and highest AIAN population.

Potential sources:
Montana Gov Health Website
Montana State University Website
Crow Nation Website
Montana American Indian and Alaska Native Population Percentage by County
Census data – demographics, income, job title, status,

*Note: Montana reports race for only 53% of COVID cases, which is one of the lowest in the country.
*Note: Montana cases only include residents and not out-of-state residents who tested positive in Montana