Categories
Uncategorized

Diana Kruzman Data Sketch 1

In Arizona, Native Americans are experiencing COVID – and dying from it – at much higher rates than other racial or ethnic groups. The rate of COVID cases for people identifying as American Indian or Alaska Native is more than three times the rate of people identifying as white, relative to population. And the death rate is much higher – about four times that of white Arizonans. This story will explore this disparity, with a particular focus on the staggering death rates and the pre-existing social and health conditions that lead to poorer outcomes for Native Americans in Arizona.

Potential Sources: 

  • Navajo Nation tribal government
  • Arizona Department of Health
  • Aid organizations such as the Navajo and Hopi Families COVID-19 Relief Fund
  • Experts from the Center for American Indian Health at Johns Hopkins

Estimated Length: 1,200 words.

Categories
Uncategorized

Serafina’s Data Sketch 3

“Unknown” Race Cases in Hawaii on the Rise

In this graph of Covid cases in Hawaii over time, two things are immediately visible:  Hawaii experienced a major spike in cases among all race in late July/August, and that for the majority of those cases, the race of patients is unknown. As we have learned, data is not necessarily objective — it is created by the people who gather, enter, and analyze it. It would be interesting to investigate what happened in Hawaii in August that led to race data being ignored or not collected.

In the data where race is collected, Native Hawaiians and Pacific Islanders make up a disproportionately large number of Hawaii’s covid cases. Native Hawaiian activists are now pushing the state to release the remaining race data, to determine what happened and if the trend continues. An interesting story idea would be to delve into this breakdown of reporting and find out what happened here. It might also be interesting to look into the major hospitals and see how they report this data, and how a major spike in cases would have overwhelmed the system to this degree.

Sources:

  • Hawaii Dept. of Health epidemiologists
  • Hawaii covid contract tracing investigators
  • Staff at Hawaii hospitals who enter and work with covid data
  • Activists with the group We Are Oceania, who are funding a helpline for Native Hawaiians

Length: 800-1200 words

Categories
Uncategorized

Serafina’s Data Sketch 2

Native Hawaiian Covid Cases & Mass Incarceration

In Hawaii, Native Hawaiians and Pacific Islanders have been hit the hardest by the coronavirus pandemic. Although it is clear that the largest population of Native Hawaiians live in this state, they have been affected disproportionately to their share of the population. According to a study from the University of Hawaii, several risk factors among this population contribute to their disproportionate infection rate. These include overrepresentation as “essential workers” in industries such as the military, security, customer service and healthcare; high rates of chronic disease; high rates of smoking and vaping; lower overall economic status, and overrepresentation in the homeless and incarcerated population.

An interesting story idea would be to examine the affect of mass incarceration of Hawaiians on their Covid rates. In the lower 48, both mass incarceration and disproportionate coronavirus infections affect the Black population at scale. In Hawaii, the same thing appears to be happening with the NHPI population. While roughly 21% of Hawaii’s population identifies as Native Hawaiian or Pacific Islander, this group makes up 40-60% of its incarcerated population. Additionally, most of Hawaii’s incarcerated people are imprisoned outside of the state — and most of these people are Native Hawaiian. This can create both an illusion of fewer Native Hawaiians imprisoned in the state of Hawaii and a disproportionately high number in other states — particularly in Arizona, where two private prisons for Hawaiian inmates are located.

Source ideas:

  • Keaweʻaimoku Kaholokula, professor and chair of the department Native Hawaiian Health at the University of Hawaii Manoa
  • Families of incarcerated Native Hawaiians
  • Hawaii Dept. of Health epidemiologists

Length: depending on sources and their availability, 1000-1500 words

Categories
Uncategorized

Serafina’s Data Sketch 1

Covid & Ethnicity in Oregon

Covid in Oregon seems to have disproportionately affected people of Hispanic heritage. Hispanic people make up the largest minority group in the state, but still only account for roughly 12% of the total population of majority-white Oregon. However, they account for nearly 37% of Covid cases.

One factor that could explain this discrepancy is the higher likelihood that Hispanics hold customer service jobs, or other jobs where they are not able to work remotely and must interface with people on a daily basis. Some of Oregon’s main industries include wineries, farms, and the Nike factory where many Hispanic people work. One story idea would be looking into those communities to see how Covid has affected them — perhaps at a specific winery or the Nike factory where many people work and have been infected.

Source ideas:

  • People of Hispanic heritage who were infected with the virus in Oregon
  • Owners/managers of employers in Oregon that employ mostly Hispanic staff
  • Oregon Dept. of Health epidemiologists

Length: depending on sources and availability, 1000-1500 words

Categories
Uncategorized

Maria Abreu Data Sketch 3

Categories
Uncategorized

Maria Abreu Data Sketch 2

Categories
Uncategorized

Maria Abreu Data Sketch 1


Pacific Islanders and Alaska Natives only represent 1% of Alaska’s population, but their likelihood of contracting Covid-19 is disproportionately higher. They are also the most likely to die from the virus. For this story, I want to explore the causes for the sharp difference and whether the hospitalization rate is also higher for NHPI. The length would be approximately 600 words.

Potential sources:

Alaska Chief Medical Officer Anne Zink
President of the Polynesian Association of Alaska
NHPI COVID-19 Data Policy Lab at the UCLA Center for Health Policy Research
Ninez A. Ponce, PhD, MPP Director, UCLA Center for Health Policy Research

Categories
Uncategorized

Maznah’s Covid Tracking Project Shift

On October 25th, I did my first volunteer shift for the Covid Tracking Project. I helped them with data entries for their afternoon shift. While I had observed a shift a day earlier and also had some practice of what to do, I was still feeling a bit nervous. I took my time reading the instructions and kept tabs on slack the whole time in order to not miss any messages that come my way.

We started with check-ins, which is always fun and then the Shift Lead (Sonya Bahar) asked us to start. I did a total of seven states that included CT, GA, IL, MP, NC, PR and WA. North Carolina perhaps was the most difficult one, because it used Long Formulas that I hadn’t done before. I followed instructions to the exact point and managed to get the correct number. Even though I was worried initially, I didn’t realize I was zooming past states while doing them. Amanda was right, it was really fun!

A lot of the states don’t update on weekends, that’s always stated in the process notes. But you still have to double check and report that they weren’t updated. Similarly for MP, I had observed a shift earlier and found out that they hadn’t been updating their numbers for some time and during my shift, it was the same case, we had to note that down on Slack so someone can keep tabs on it.

I did have an interesting incident where I was updating numbers for Washington and right after I had finished, they updated their numbers on the dashboard. Amanda was super helpful and explained that this happens sometimes and less likely now that they have the “check next” feature but still sometimes this can happen.

I found the Slack coordination to be really helpful because if I faced any problem, I would post it in Slack and immediately get guidance from Double Checkers and the Shift Lead. It is amazing how the Covid Tracking Project has managed to define every single thing to the point that a newcomer can understand exactly where to go to find data just by following instructions. At first, it may seem complicated but it was actually interesting and also fun.

While working with all of these talented individuals, I felt like a part of the team. They were so encouraging and appreciative during the shift and always took out the time to explain the errors made and how to correct them. It felt very welcoming and I would love to volunteer for another shift because of this experience. This time I’d want to try my hand at more complicated states too.

Categories
Uncategorized

Catarina’s Covid Tracking Project Reflection

What I find the most fascinating about the Covid Tracking Project is how the team was able to pull together a tracking system from such a confusing and inconsistent number of sources. It’s surprising, on one hand, that the country doesn’t have a uniform way to pull this type of data together all together. But on the other side it’s fascinating to hear about and see how the The COVID Tracking Project developed.

I also really appreciate how they were able to find practical solutions to put this project in motion — from getting a system of volunteers in place to cover all shifts to establishing clear channels of communications to help everyone go through the work and troubleshoot together, and making sure that everyone gets proper training, practicing and then observing. Like a lot of data work, I think it maybe takes a little bit to get introduced to the work, but once you do, it’s actually much easier.

My three states for the practice exercise were Virginia, Virgin Islands and Vermont. I have to say I was surprised by how much longer than I thought it took me to get the hang of it. I actually tried a few states first where I struggled with their website, so I had to change. In the end, I spent a lot of time figuring thing out. It was honestly a little bit frustrating —I had to ask for help from people from class a few times. But then when I understood it, it took me only about 10 minutes to finish all three states.

I haven’t managed to do a shift yet, because I saw that they were all booked up for the weekend, so I have to do it this upcoming week. I’ve looked at the data spreadsheet and I feel confident that I am well prepared for my shift — especially after the initial training we went through.

Categories
Uncategorized

Maureen’s COVID-19 Tracking Project Shift

I completed my COVID-19 Tracking Project shift on Monday, October 26, 2020. I would be lying if I said I wasn’t nervous. The week we first learned about the project and how to operate it, I was really sick, and it was a struggle to keep up with our training, let alone my other classes. Also, seeing so many numbers on a screen was (and still can be) super intimidating. Even though I had completed my training going into it, I was scared I wouldn’t be able to keep up and that I’d make lots of mistakes.

So I was grateful that at the beginning of the shift, the shift leader, Brandon, made sure to ask if anyone was new, or anyone’s first shift. Once I messaged that it was my first shift, Hannah Hoffman directly messaged me. She asked if I’d feel comfortable observing for the first part of the shift and then checking for the rest. I definitely felt more at ease that she was there specifically to help me if I needed, and that I could directly message someone for any questions.

When the time came for me to check, Hannah reminded me that I couldn’t copy and paste numbers. So I took out my notebook to write every number down. I was a bit appreciative for that, because I feel more comfortable writing notes by hand than on a computer. I  started first with Nevada, then Pennsylvania, and lastly Illinois.

I believe that you don’t learn something fully until you do it. And in this shift, I learned things I didn’t realize in training. For example, in Nevada, one box, “Recovered”, asked me to use the “Other Link”. After asking Hannah, I learned that means that there is a separate link to a data website for that state. She also sent me a document with a list of terms for the boxes which I had not seen before. This definitely helped as I continued to check. Also, with Pennsylvania and Illinois, I didn’t realize I had to also check the time stamp of when the data was last updated. I was a appreciative of both the double checkers, Hannah and Nadia, for pointing that out to me.

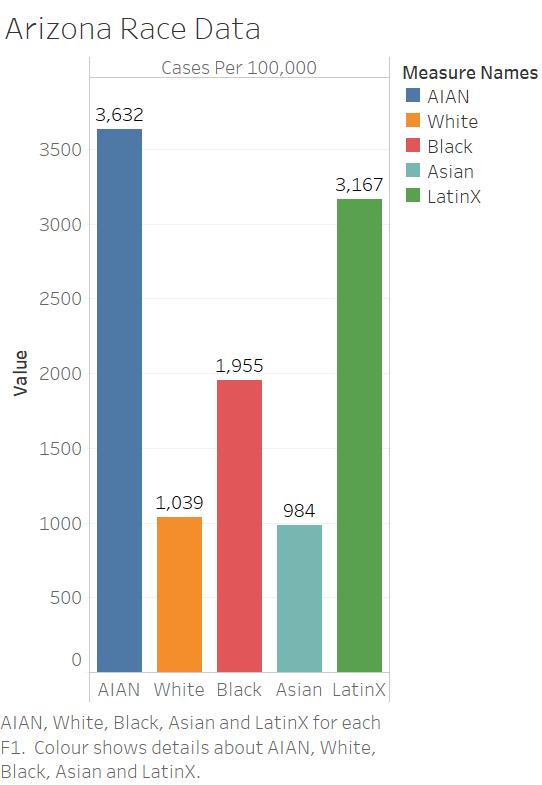
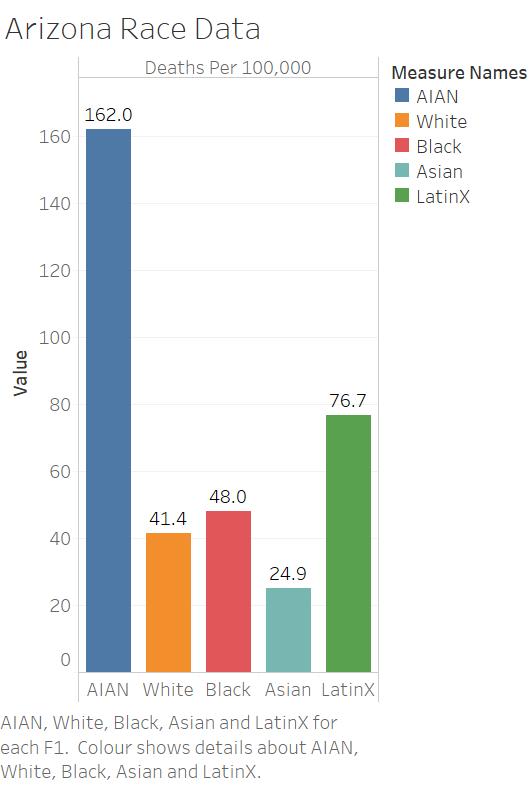
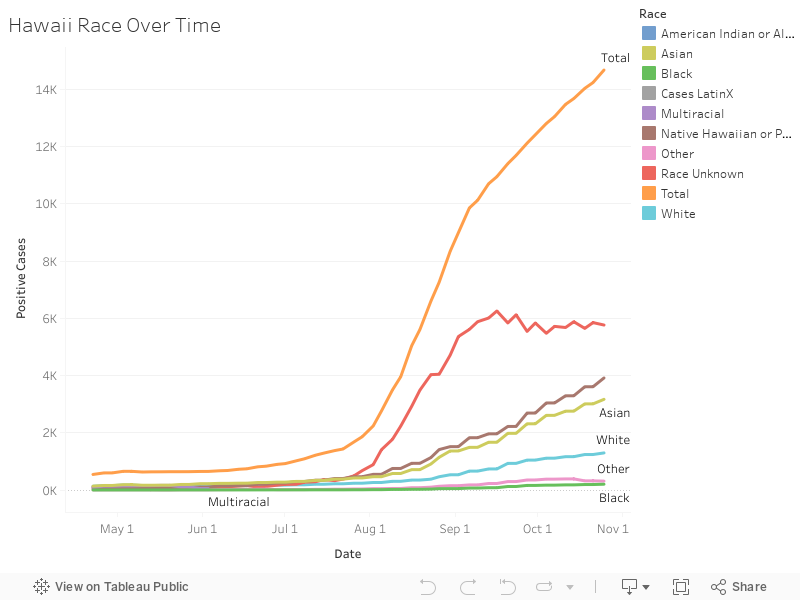
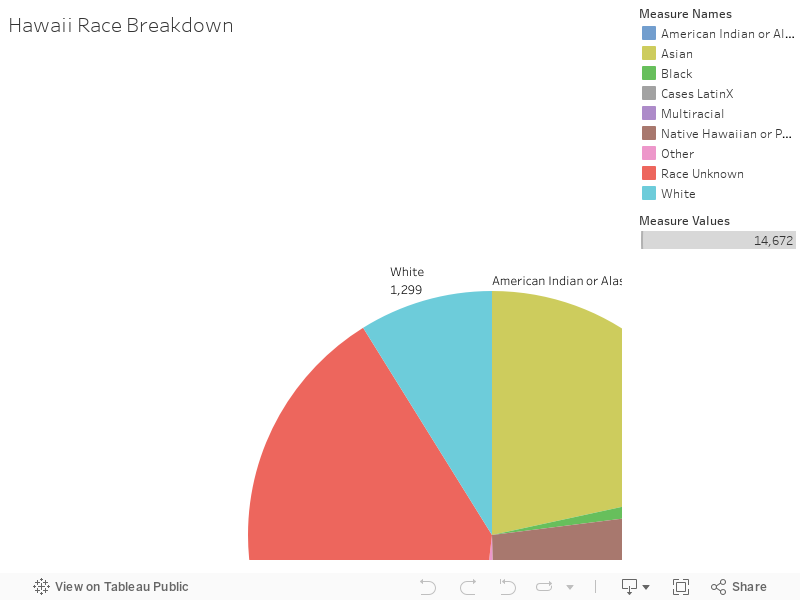
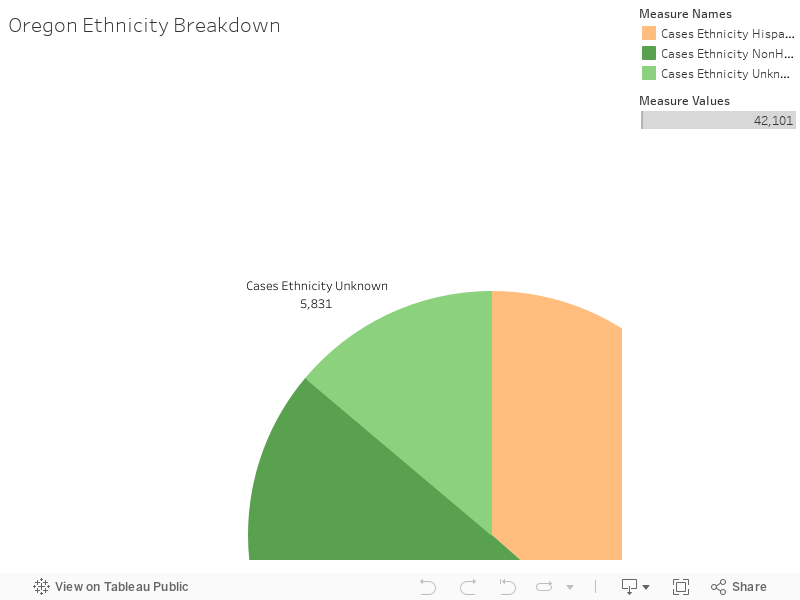
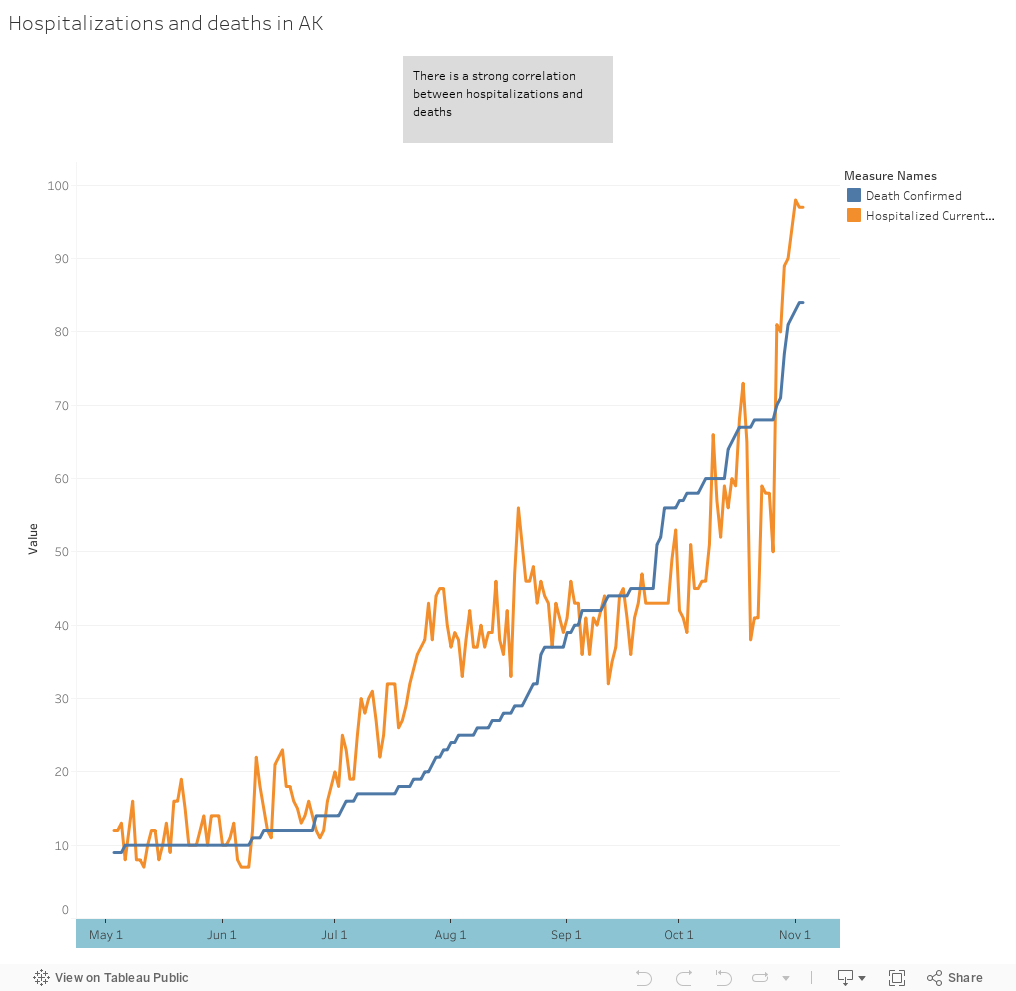
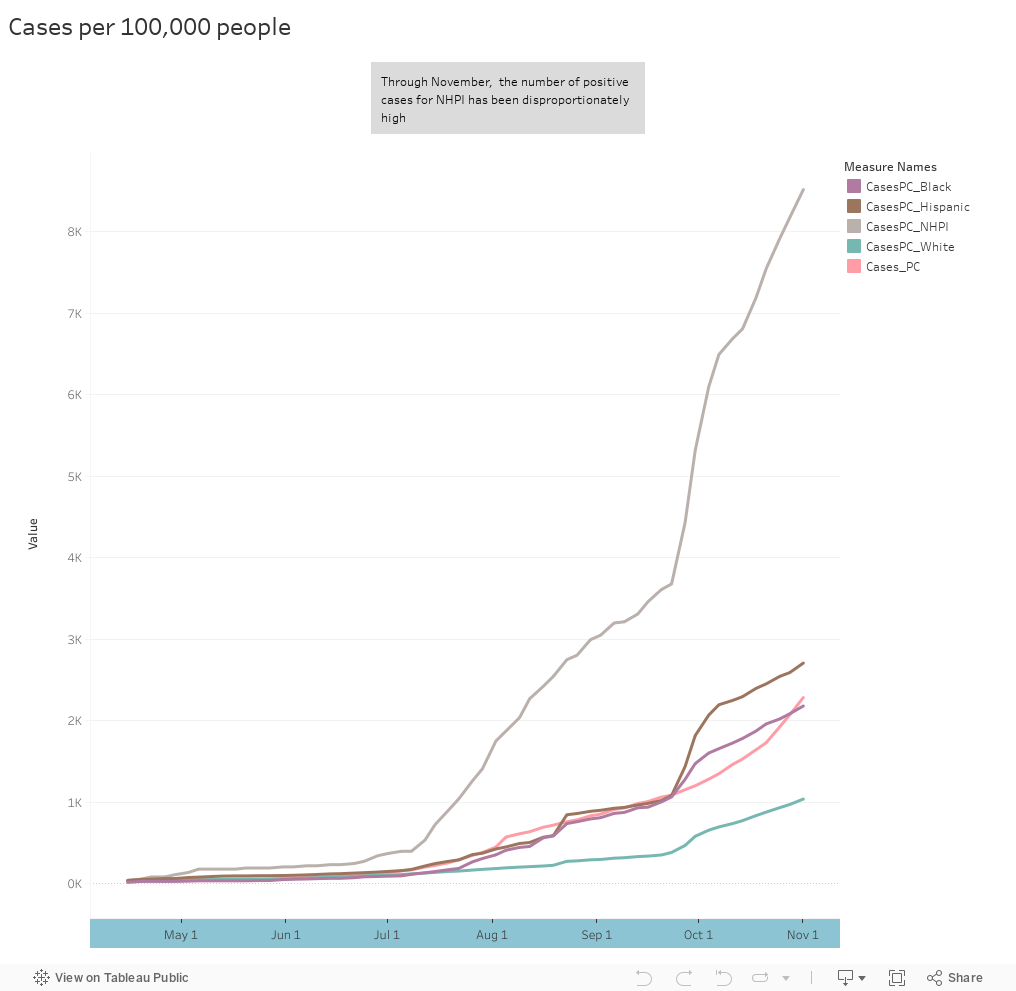
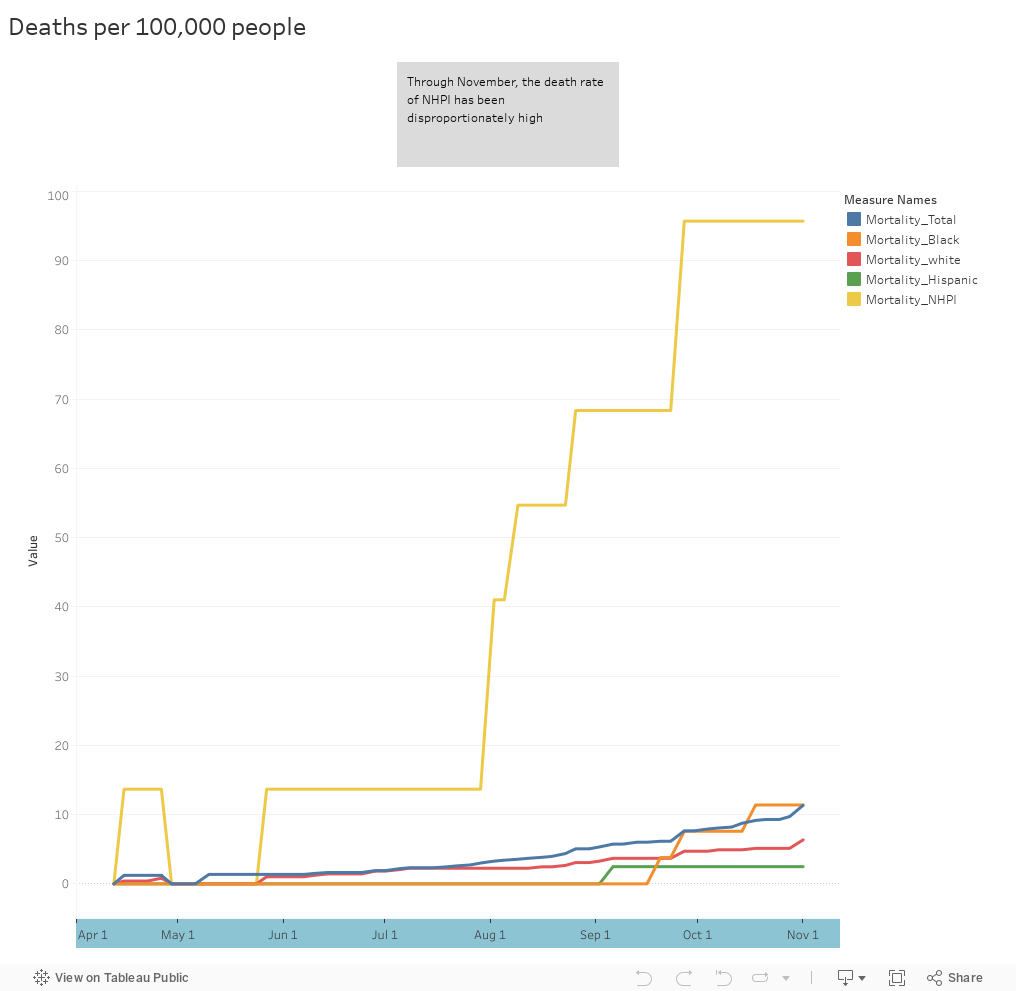
It was also definitely interesting to see the similarities and differences in how each state I checked tracked the data. Nevada, Pennsylvania and Illinois all had intricate graphs and information by county, demographics, hospital preparedness, etc. I think because I was so focused on making sure the numbers I copied were accurate, I didn’t think that analytically. Looking back, I think that since these three states have so much data tracking in common, how much easier it would be if they all followed one format, instead of different ones.

As soon as I got the hang of checking the states, I actually found checking to be quite fun, and felt a sense of accomplishment once all states and territories were completed. I’d definitely be down to do it again!