Categories
Uncategorized

Sam Krystal Data Sketch 1

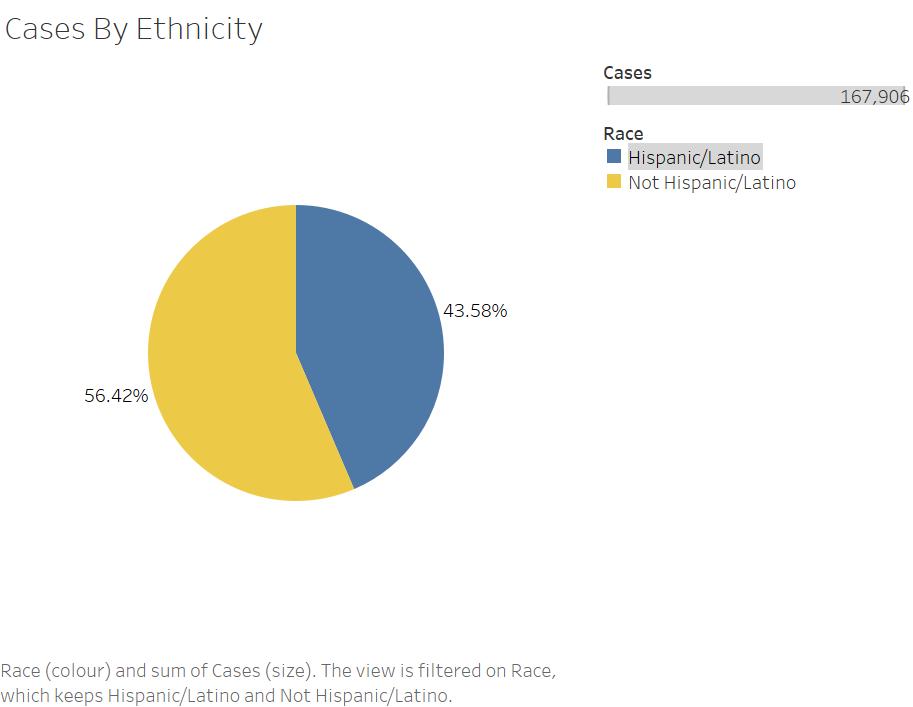
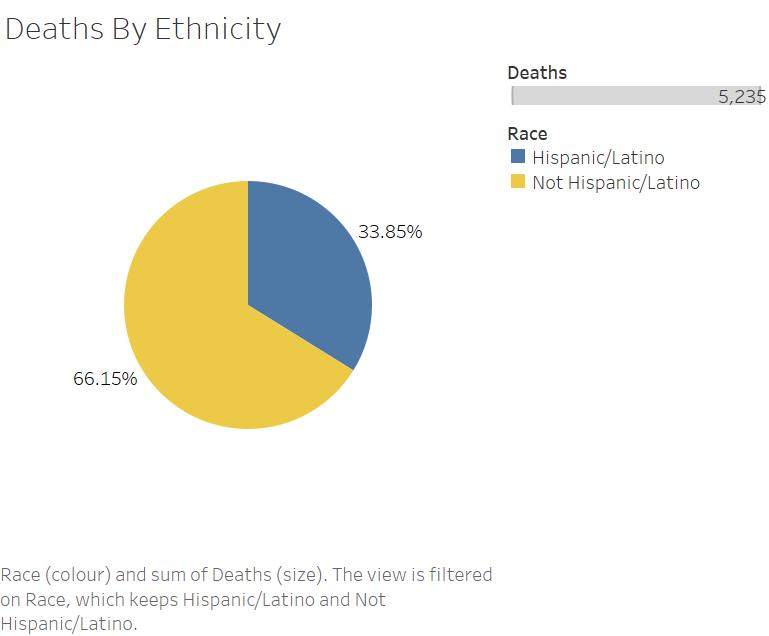
Nebraska: Who are your Unknowns?

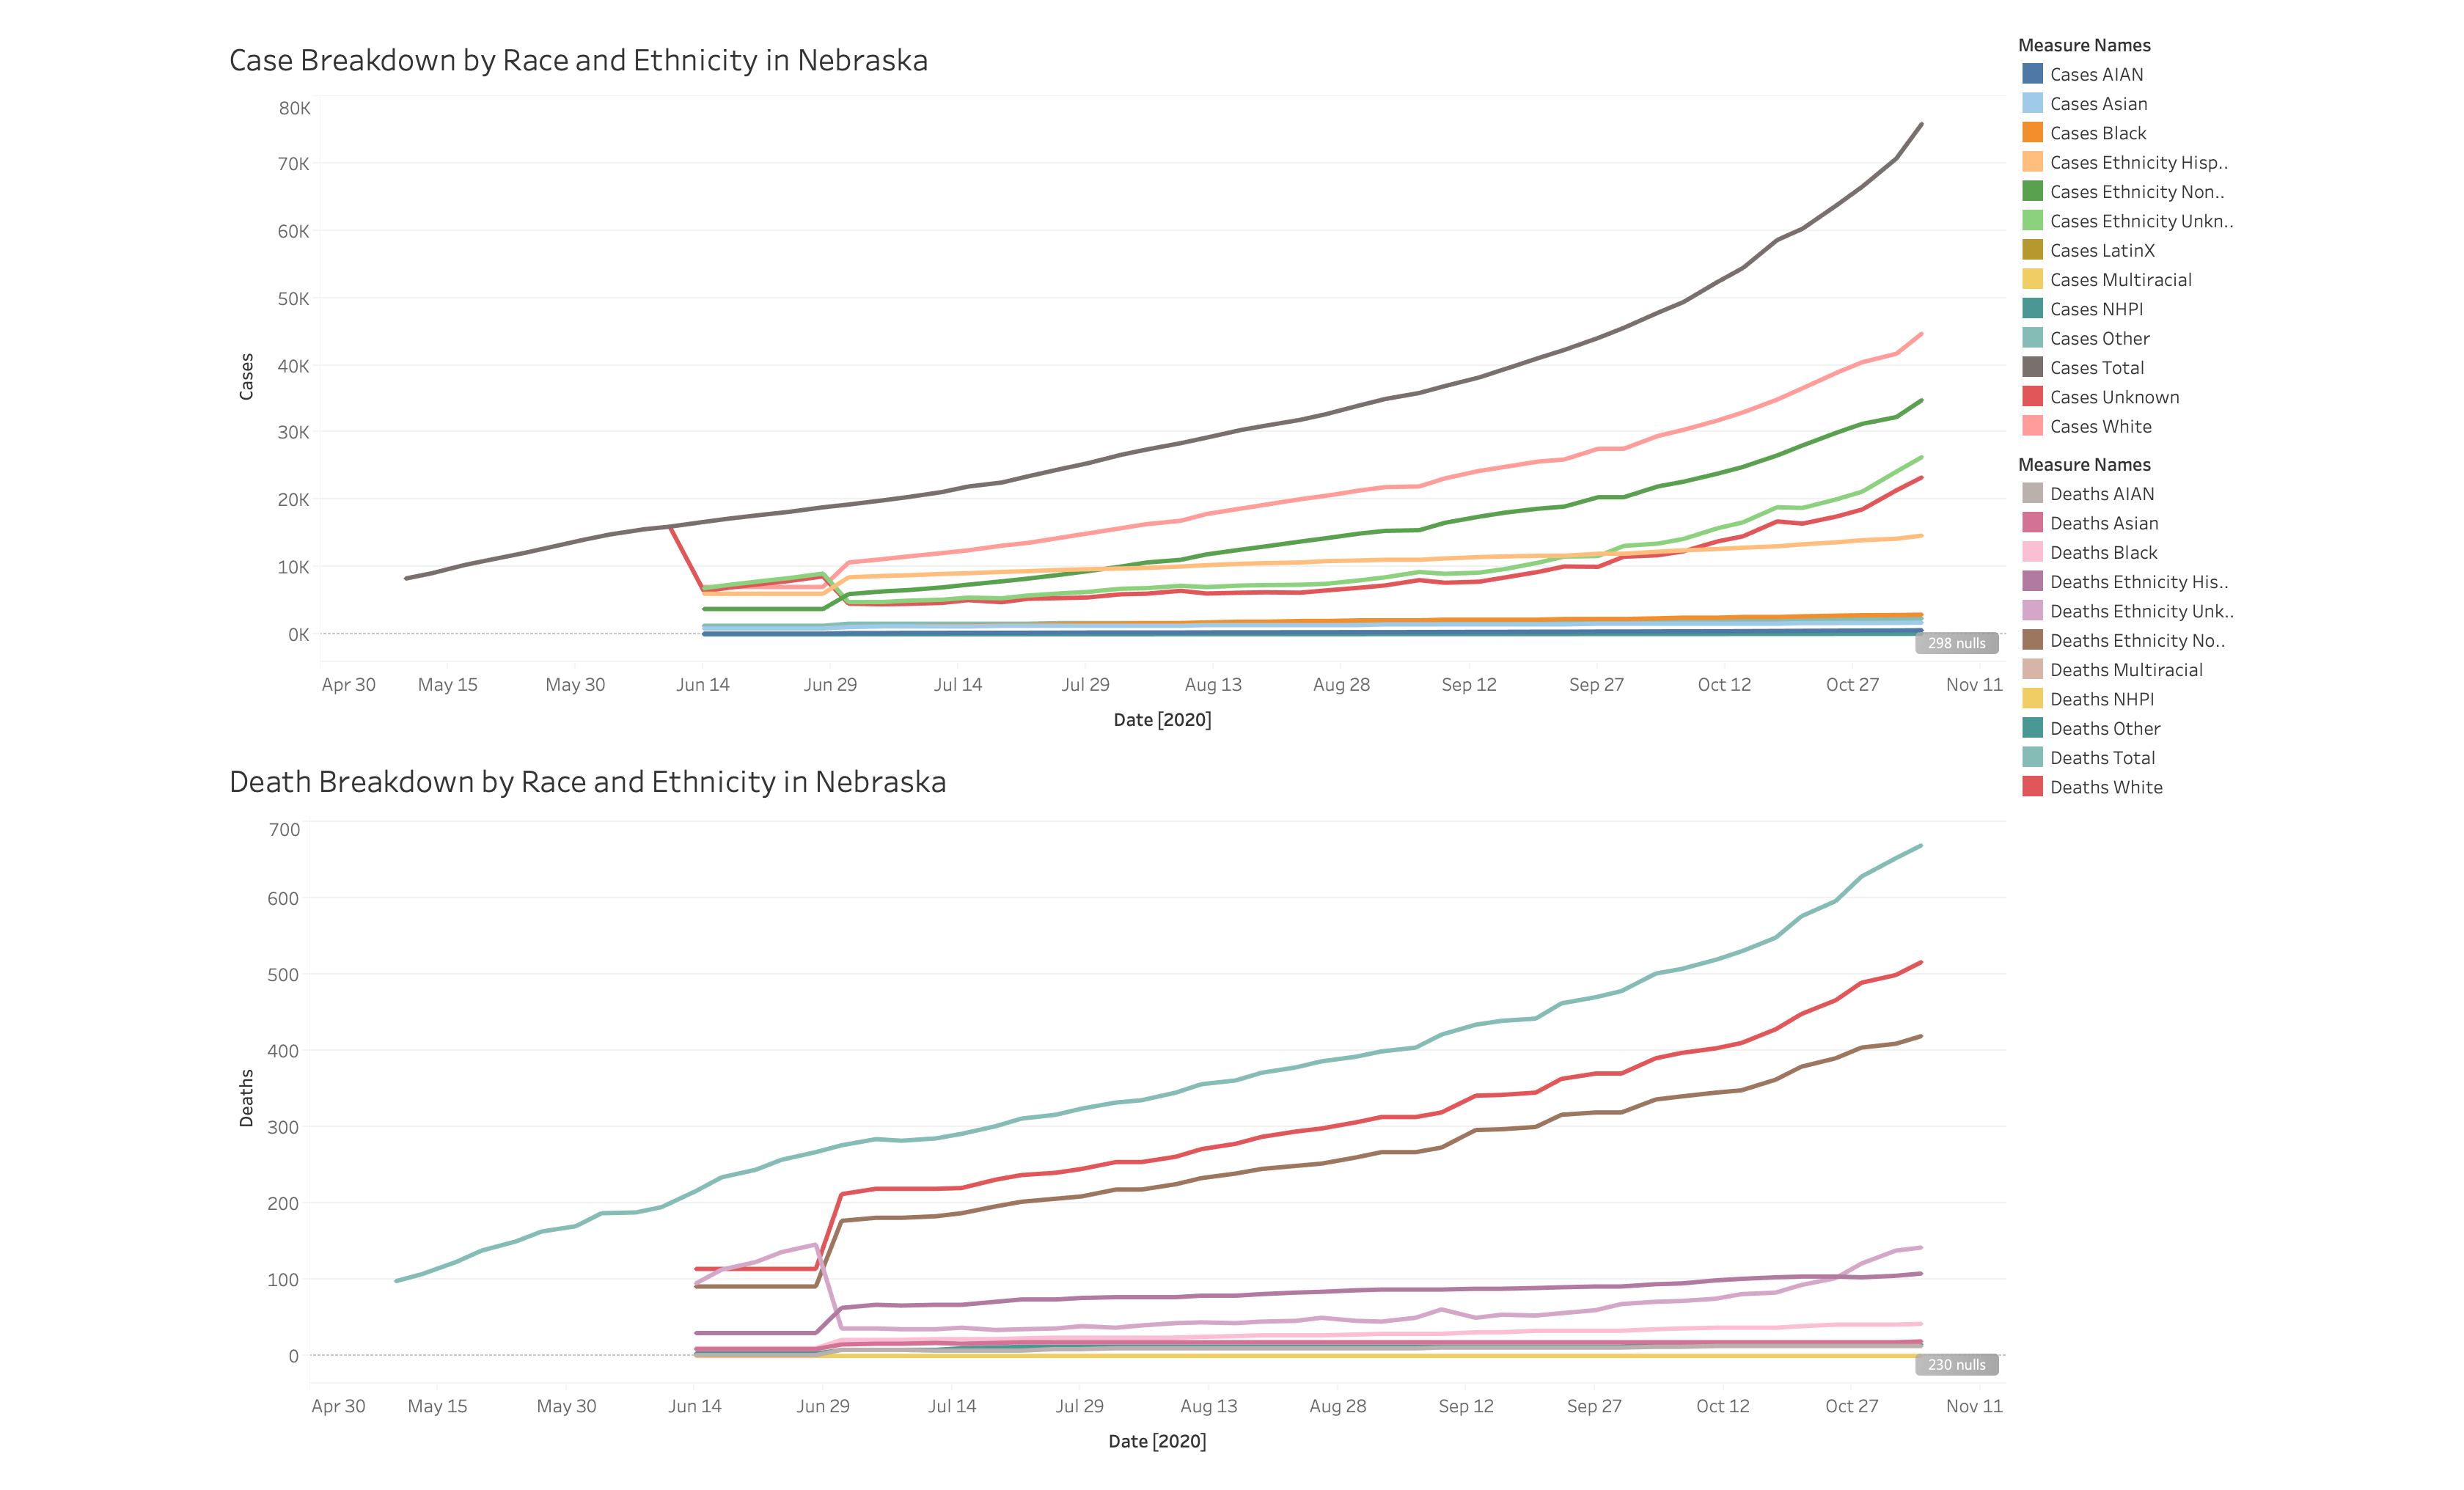
Throughout the Spring of 2020, journalists in Nebraska called for the release of Covid-19 case and death data by race and ethnicity. The Nebraska state government acquiesced in late June, reflected in the stark dip in the “unknown” race and ethnicity case and death incidences around that time. Despite the increased reporting of race and ethnicity data, “unknown” ethnicity and race cases and death rates continue to rise at a disconcerting rate, outpaced only by white and “non-Hispanic” race and ethnic groups. I would like to investigate which counties are contributing to the increasing count of “unknown” cases and deaths, as not all Nebraskan counties have this data easily accessible. I am particularly concerned that the “unknown” population rates may be attributable to Covid rates in Nebraska’s prisons. Nebraskan prisons are situated in counties that do not have easily accessible Covid race and ethnicity data, are experiencing intense spikes in Covid, and do not disclose race and ethnicity data in their Covid dashboard. To that end, I would try to gather data from Nebraska’s department of corrections and Nebraskan counties that do not publicly report Covid race and ethnicity data, and compare and visualize that data with our data.


I could envision this piece sitting at approximately 1500 words.


Potential Sources:

  1. Nebraska Department of Corrections
  2. County-level health data reporting agencies
  3. Nebraska Office of Health Disparities and Health Equity
  4. ACLU Nebraska
  5. The Vera Institute
Categories
Uncategorized

Maznah Shehzad Data Sketch 3

Pitch: Oklahoma’s Covid cases disproportionally affect the minorities. American Indian/Alaskan Natives have the highest rate of cases and deaths according to the CTP data. Since Oklahoma is predominantly white as well, it would be interesting to see why minorities are the ones facing the brunt of this pandemic. What are the reasons that differentiate these groups? Is it income? healthcare benefits? community gatherings?

Sources: Oklahoma State Department of Health.

US Census Data for Oklahoma

Payne County Health Department

Words: 650


Categories
Uncategorized

Maznah Shehzad Data Sketch 2

Pitch: This viz shows deaths by race in West Virginia. What is interesting to note here is specifically the month of October. West Virginia is predominantly white so there is no surprise there that the highest death count is coming from them. But it is interesting to note that in the category unknown we see a sudden sharp decrease in October. In the previous months it was increasing suddenly and then in October it dropped to the lowest level when compared to other categories. My biggest question to start with is who is in this category. Then why was there a sharp decrease in October. The sharp increase in deaths for the white community may be due to the nearing of election and the rallies. But I am really interested to know why the unknown category dropped. They haven’t even changed their method to record data so that cannot be the reason.

Sources:

West Virginia Department of Health and Human Resources

Length: 800 words

Categories
Uncategorized

Maznah Shehzad Data Sketch 1

Pitch: West Virginia has a very simple set up for a complicated population. Even though according to the census, white is the most prominent race in the state, it is necessary to count other races as well given that they are a minority there. One of the things in the data that seemed interesting was how WV started to count Native Hawaiian Pacific Islander cases and then stopped and grouped them with “Others”. Similarly American Indians faced the same fate. Asians, NHPI, AI and all other races that aren’t Black and White go into either other or unknown. One of the reasons in the CTP data states that because of small or no numbers, they decided to aggregate it. But then why did they start counting NHPI in the middle and stopped and also NHPI is a smaller portion of the total population compared to Asians in the census. Why weren’t Asians counted separately then? Why is it grouped together?

Sources:

West Virginia Department of Health and Human Resources

Census Data West Virginia

Asian American Advancing Justice

Length: 800 words


Categories
Uncategorized

Bessie Liu Data Sketch 3

Pitch

In a state that is 93% white, it is unsurprising that the largest death amount is the white population. What intrigues me is the death of a large number of people whose race is unknown. I would be eager to know why the race data is uncategorized, was it poor data collection? Were people unwilling to identify their family members’ race? I would look more deeply into exactly where the most amount of deaths occurred for these uncategorized races – is there a specific demographic of people who live in the area? Who were the hospitals involved?

Potential Sources

United States Census Data on New Hampshire

The New Hampshire Uniform Healthcare Facility Discharge

Division of Public Health Services

Department of Information Technology

The New Hampshire Hospital Association

Length

Roughly 600 words


Categories
Uncategorized

Bessie Liu Data Sketch 2

Pitch

Colorado saw a huge spike in deaths in both Hispanic and Non-Hispanic communities. Would be interesting to examine the cause of these deaths, and the proportion of deaths in comparison to the Hispanic community in the state. I would be interested in knowing what lead to the spike in deaths – was it the lack of hospital beds and ventilators? Was it the state unwilling to close down shops and businesses? This will give a better idea of examining the root cause of the spike in deaths, and whether or not it was handled appropriately afterward.

Potential Sources

Colorado Hospital Association

United States Census Data on Colorado

Colorado Department of Health and Environment

Colorado State Emergency Centre

Colorado Health Institute

Length 

Roughly 1000 words

Categories
Uncategorized

Bessie Liu Data Sketch 1

Pitch

COVID 19 cases in Colorado seem to have disproportionately affected Latinx communities – especially when related back to the population per capita. Latinx people make up only 21% of the entire population in Colorado. It would be interesting to examine why COVID has infected such a large amount of people in the Latinx community in this state, examine how many of these cases translated into deaths, and how many of these cases were recovered. Would also look into how the virus may have been transmitted – is it work-related? Larger families? – Would look at wage data and the total number of people in the household.

Potential Sources

United States Census Data on Colorado

Colorado Department of Health and Environment

Colorado State Emergency Centre

Colorado Health Institute

Length 

Roughly 800 words


Categories
Uncategorized

Elli Garcia Data Sketch 1

Pitch
In the state of Arkansas, Hispanic/Latino residents make up 7% of the population (Census data), however are making up 15% of confirmed COVID-19 cases. To better understand how the third largest racial/ethnic group is contracting the virus at disproportionately higher rates, I propose investigating Springdale, AZ, a city which sits in the counties of Washington and Benton. Note that these counties also rank #2 and #3 in the state with the highest number of COVID-19 cases, after only Pulaski county. Springdale happens to have the largest population of Hispanic/Latino residents (28,600), making up 36% of the city’s population of 76 thousand. What makes this story most interesting is that the city is home to the world headquarters of Tyson Foods, the world’s largest meat producing company, which has been reporting clusters of outbreaks at their US plants since April 2020. In June, the Chinese government suspended all exports from Tyson after the Springdale, AR plant experienced an outbreak.

What is interesting about this story is that media coverage revolves mostly around the general implications of the outbreaks for the company and its workforce, but does not get into the demographics of the city and/or the demographics of the workers most impacted by the outbreaks. It is important to understand the correlation between COVID-19 infection rates, Tyson foods operations and employment rates, and Hispanic/Latino population. I envision this piece to be around 800-1000 words highlighting the infection rates in meatpacking, poultry, and food processing plants in the state and how companies are taking action to remedy these malpractices. Furthermore, I will examine how the Hispanic/Latino populations are most impacted in this region by reviewing health care, PTO, and sick-time policy.

Potential Sources
Former employees of Tyson
Angela Stuesse from Washington Post who has written on this
Tyson 10K and press releases
Social media listening – scrape comments from Twitter

Categories
Uncategorized

Diana Kruzman Data Sketch 3

In recent years, North Dakota’s Black population has grown rapidly, particularly fueled by immigrants from African countries. At the same time, the CRDT data show that the rate of COVID cases (per 100,000) for Black people in North Dakota is almost twice as high as for white people. This story will explore this disparity and the factors that lead one group to be more likely to experience the disease than another, from work opportunities and poverty to pre-existing health conditions. Moreover, North Dakora does not release death rates by race, so I would want to anecdotally explore whether Black people in North Dakota are also more likely to die of COVID than other groups.

Possible Sources:

  • North Dakota Health Department
  • North Dakota NAACP
  • University of North Dakota Medical School
  • Afro American Development Association
  • Somali Community Development of North Dakota
  • Sudanese Community of Fargo Moorhead

Estimated length: 1,200 words.

Categories
Uncategorized

Diana Kruzman Data Sketch 2

Although Arizonans who identify as Hispanic/Latino make up 31.74% of the population, they make up 43.58% of COVID cases across the state, a disproportionate number. However, that percentage goes back down to 33.85% for COVID deaths, begging the question of whether Hispanic/Latino Arizonans have better COVID outcomes (i.e. if they get sick, they’re less likely to die from the disease), and if so, why. This story will explore outcomes for Hispanic/Latino people across Arizona and why this group is both more likely to get sick and less likely to die.

Potential Sources:

  • Arizona Department of Health
  • Nonprofit group Chicanos Por La Causa
  • The University of Arizona Health Sciences – Hispanic Center of Excellence
  • Arizona Latin-American Medical Association

Estimated Length: 1,200 words.