Data can help journalists find better stories
Data science and visualization are becoming basic tools in the newsroom kit.
Data journalism — also called computational journalism or computer-assisted reporting — is the art of using digital data sets to illuminate something about the world that people who are not experts need or want to know. As more and more data is being put online, and as tools for managing and visualizing it have improved, data journalism has surged in importance in contemporary newsrooms.
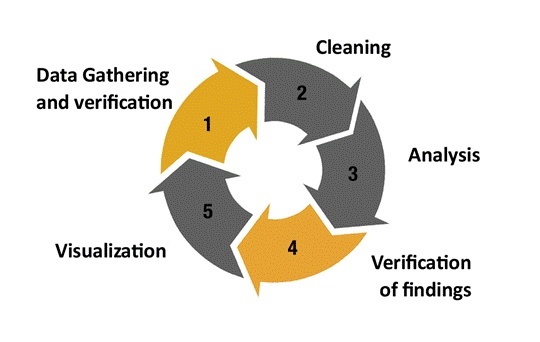
As sketched by its leading practitioners, the major steps in data journalism are:
- Finding data sets that may contain stories or prove useful. This may include filing FOIA requests from government, which takes time — sometimes years.
- “Cleaning” the data. All data sets contain errors, imperfections and small glitches that have to be removed before the real work can start. New tools are making this a lot easier but it can still be tedious and time-consuming.
- Analysis: finding significant trend lines or stories in the data that may be worth reporting.
- Verification: do the findings make sense? Do they cohere with what else we know? Can we check them against on-the-ground reporting? Are we making a mistake?
- Visualization: making the data come alive for users with charts, tables, maps, illustrations and the like.
Sarah Cohen, editor of the New York Times computer-assisted reporting team, cautions: “Just like most of your notes never end up in a story, or most of the photographs taken don’t end up published, most of these [visualizations] are used only for our own understanding, not for publication. If it works, that’s fine. If not, well, it’s just part of the process.”
Often in data journalism the final product is an “interactive,” which means a published feature that permits users to explore the data themselves by clicking around in it or entering personal information like a postal code.
Key quotes
Don't get too involved in seeing things as an arbitrary mix of tools and techniques to memorize, or you're going to want to quit civilized life to live in the mountains.
Cleaning data 'is often the most time consuming part of the data journalism process.'
Some new insights might mean the beginning of a story, while others could just be the result of errors in the data, which are most likely to be found when visualizing the data.
It’s more common NOT to publish than to publish.
Data journalism is the practice of analyzing data in order to unearth new stories. Structured journalism is the practice of turning one’s reporting into data that can be repurposed in any number of ways.
We will know that we’ve done a good job on this when people stop using this term ... when data journalism is so constant that it’s just journalism, as it always has been and always should be.
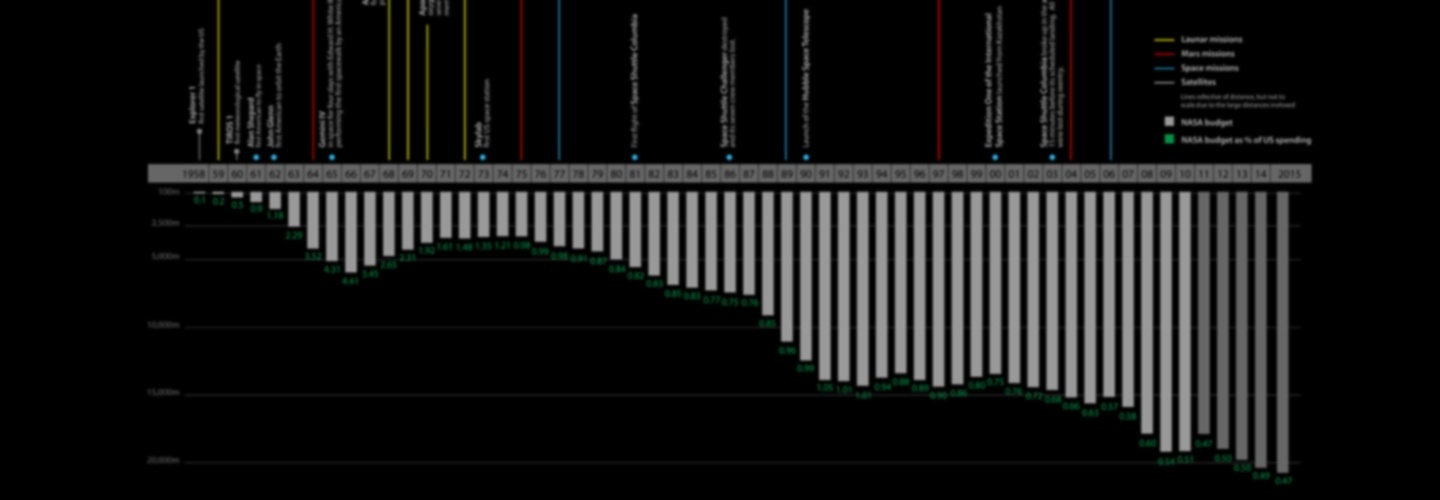
Useful charts and graphs
Phases of an investigation with data
 Global Investigative Journalism Network
"Two key verification tasks need to be performed during a data-driven investigation: An initial evaluation must occur immediately after getting the data; and findings must be verified at the end of the investigation or analysis phase." - Giannina Segnini
Why is this important?
The world runs on data. Technology makes it easier than ever to manage large data sets. Journalists have to harvest this new capacity for the benefit of an informed public.Killer links
- Tow Center for Digital Journalism A brief history of computer-assisted reporting
- Tow Center for Digital Journalism The art and science of data-driven journalism
- Tow Center for Digital Journalism How data journalism creates scoops and audiences
- Global Investigative Journalism Network Investigating with databases: Verifying data quality
- Poynter Using data visualization as a reporting tool can reveal story’s shape
- Poynter Where The Journal News went wrong in publishing names, addresses of gun owners
- Columbia Journalism Review ‘Structured journalism’ offers readers a different kind of story experience
- Poynter Explore the makings of interactive journalism
- Gigaom Open journalism also means opening up your data, so others can use and improve it
- The Paley Center for Media Why data matters in the modern newsroom
People to follow
-
 NICAR trains journalists in the skills of getting and analyzing data.
 -
 DataDrivenJournalism is a source of training, resources and networking.
 -
 ProPublica Nerds is the blog of the organization's News Apps team.
 -
 Jonathan Stray is a freelance journalist and computer scientist.
 -
 Simon Rogers is Google's data editor and the creator of the Guardian Datablog.
Karissa Gall
@jhrnews alumnus. @Studio20NYU master of journalism candidate working on adapting journalism to the web. I travel with a mini trampoline.