Analytics aren't just for counting audiences, but for reaching them
Sophisticated use of analytics can create richer editorial experiences, build deeper relationships with readers, and increase ad revenue.
For much of its existence, the newspaper business had a straightforward way of measuring readership: counting how many copies were sold over a given period. It didn’t matter if a consumer read the paper front to back, parsed it to find the most personally relevant content, or just completed the crossword puzzle; advertisers paid for ads based on print circulation alone.
Yet, publishers and editors didn’t know how their audiences were engaging with the news. At best, audience engagement was misinterpreted. At worst, it wasn’t considered at all. When newspapers were thriving, this wasn’t an issue. But amid today’s dramatically shifting news business, knowing how readers consume information should be a fundamental and urgent concern for news executives.
In response to this emerging need, newsrooms developed tools to measure pageviews and unique visits, but those, too, proved problematic if the sole focus was on scale. Too often, analytics marked the end of a question–how many people visited the site–rather than opening up a dialogue on how better to understand audience behavior, attitudes, and experiences.
In the hunt for sustainable business models, focus on metrics turned some reputable news outlets into content farms, with writers churning out as many stories as possible to increase ad revenue. As news consumption went digital, figuring out how to monetize ads in a market of abundance was an ongoing dilemma. Clickbait was born, and virality was the mark of success. Gawker Media created a system whereby employees would take turns writing viral-worthy content because more views meant higher ad dollars.
News organizations began harnessing new tools to gauge readership on the internet. In the digital landscape, where ad revenue dictated editorial strategy, the drive toward sheer quantity continued. When page hits went out of style, unique visitors came into vogue. Gawker and other media outlets shifted their editorial strategies to increase the number of new readers.
Eventually, news organizations found that an obsession with scale not only destroyed their brands but also failed to monetize them. What works in one newsroom will not work in another, and metrics must be specific to a company’s bottom line, mission, and goals.
There are three distinct ways analytics can inform a newsroom:
- audience development
- editorial coverage
- business development.
When looking at analytics for editorial strategy, news organizations should consider whether a beat is being covered properly. What stories can be skipped to invest in more relevant topics? Then the outlet can go from there to find methods that best measure a story’s impact.
The Louisville Courier-Journal, for instance, adjusted its editorial planning of the Kentucky Derby coverage based on what people were engaging with and witnessed a bump in readership and ad revenue. The newspaper’s site also ranked fourth in a Google search for “Kentucky Derby.”
News outlets like BuzzFeed have made understanding analytics key to digital strategy. In 2014, the company named data scientist Dao Nguyen it’s publisher, a role that had traditionally been to oversee business operations and sell advertising. But Nguyen, said BuzzFeed chief Jonah Peretti, would instead “lead publishing for the social web, in the most modern sense, where data science, the [content management system], technology, and a deep understanding of social networks, mobile device, and digital video matter most.”
Audience engagement teams can more deeply understand a publication’s audience by analyzing who is reading stories according to demographics such as age, sex, gender, and income. News organizations can then adjust editorial workflow according to these engagement metrics.
On the business side, it’s vital for newsrooms to be able to show advertisers in detail how they are building and maintaining relationships with specific, targeted markets rather than opting for a one-size-fits-all strategy of reaching an amorphous mass audience.
Publishers need to pay attention to relative data over absolute data: a pop culture story may do better than a politics story, but that doesn’t mean politics isn’t as important. Likewise, poor readership doesn’t necessarily mean a story was shoddy or not worth publishing. Instead of abandoning an important news story, news organizations should work to reshape how it’s being covered in order to reach more people. As Gannett’s Anjanette Delgado says, “Don’t equate the quantifiable to the valuable.”
Ultimately, metrics don’t tell the whole story of audience or of a reporter’s success and shouldn’t be the foundation for all editorial decisions.
Key quotes
Here’s what we want next. All the data for every anatomized piece of the story across the web and apps, regardless of platform, in one big beautiful tool that visualizes data, calculates the data, includes a chat channel and eliminates the need for downloading your data.
What our vision is for it and what will get built will be two different things.
Step one is giving everyone on the editorial team access to your analytics. Once the data starts rolling in, it can be challenging to figure out what it means. The answers aren’t in performance metrics for individual posts as much as they’re in the narrative the analytics tell over time, and it helps to tease out that narrative as a team.
Even two years ago, when we all lived in a simpler media landscape, we believed there was no “one metric to rule them all.” Today that is even more true. To measure the overall reach of the company, we look at a combination of metrics that are available across platforms.
Be human: Some kinds of impact are not quantifiable.
Analytics dashboards
Chartbeat
 Chartbeat
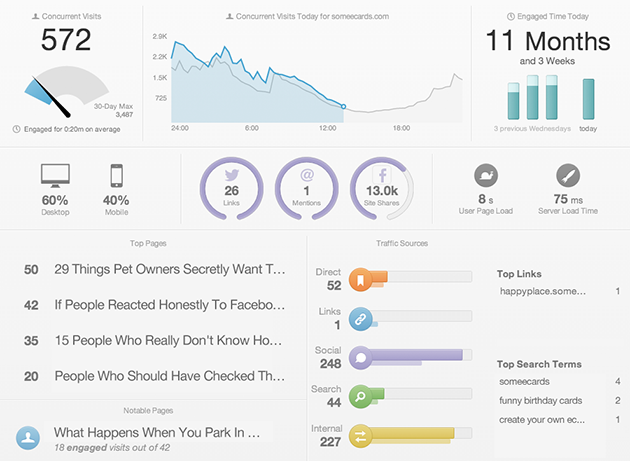
Chartbeat measures and monetizes attention for publishers, brands and agencies. It is used by The New York Times, New York magazine, Forbes, Time, Financial Times, Bleacher Report, USA Today and Gannett subsidiaries, among others.
Parse.ly
 Parse.ly
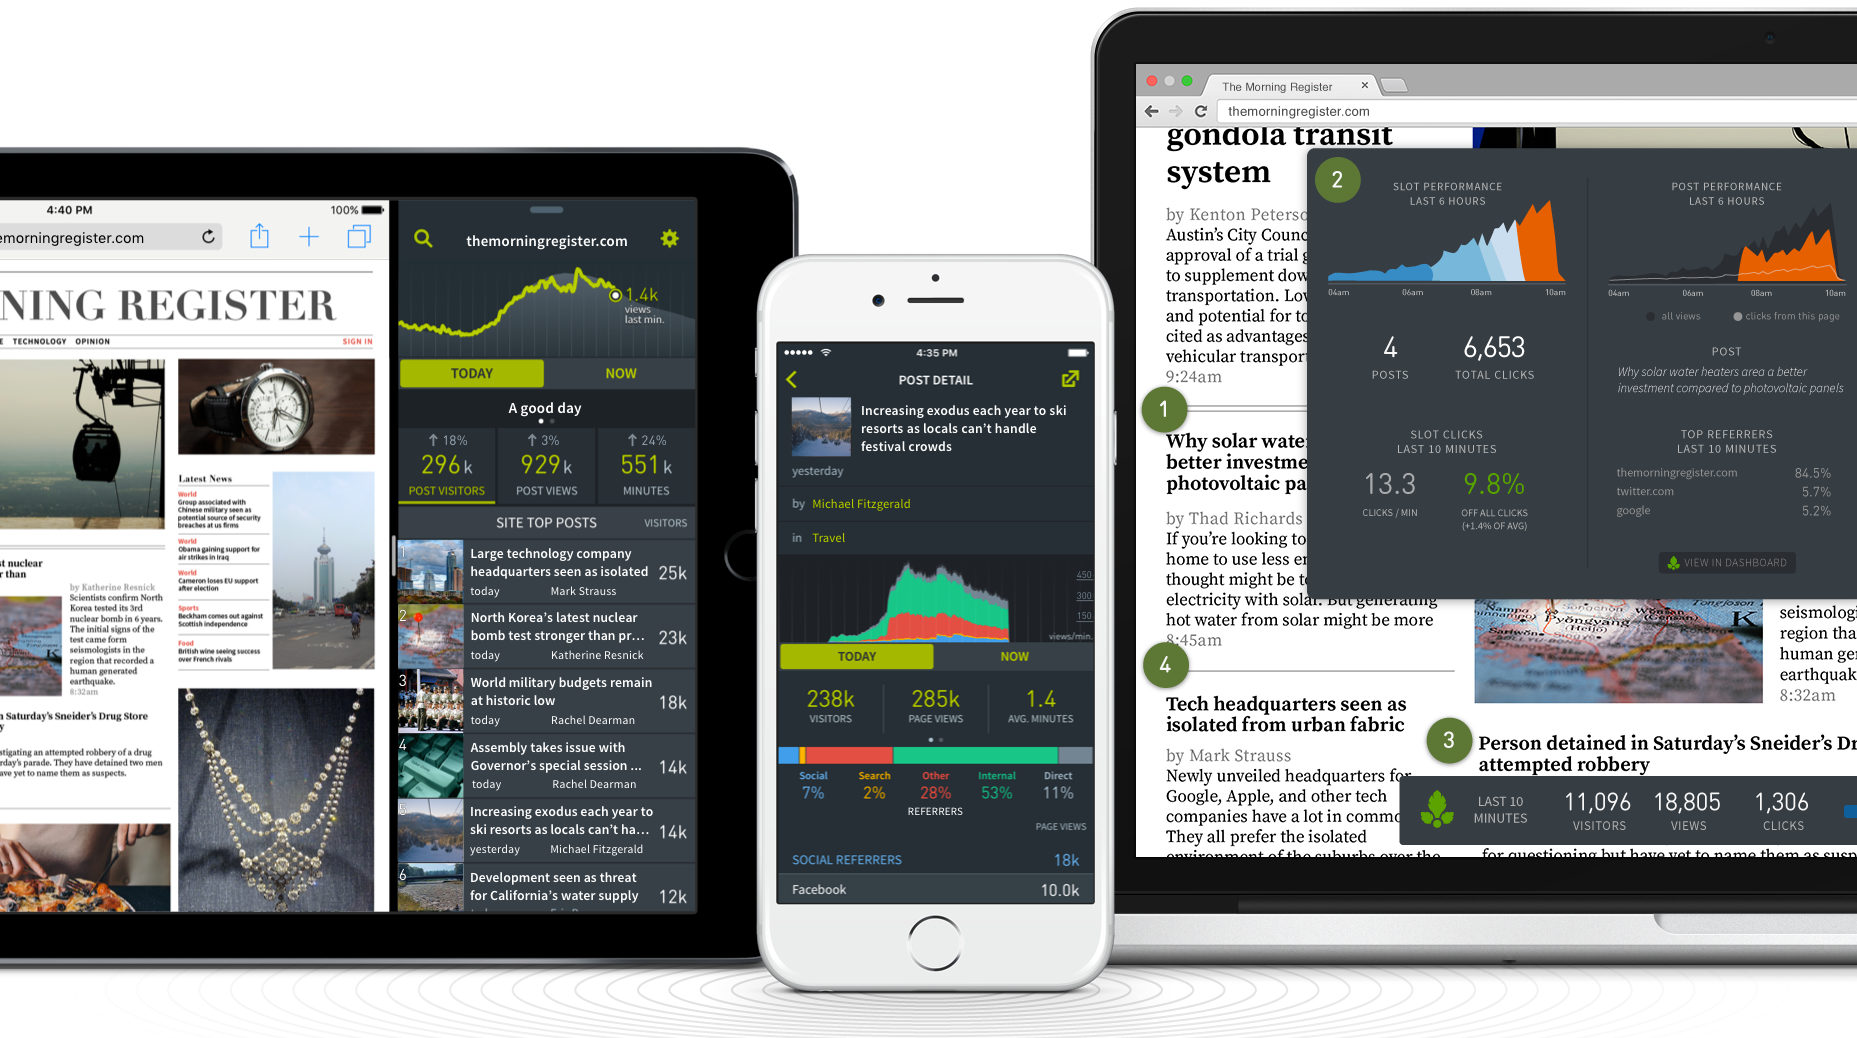
Parse.ly measures insights for editorial staff, product teams, data analysts and sponsored content producers. It is used by The Huffington Post, Mashable, TechCrunch, the New York Post, Upworthy, The Daily Beast, Slate and Condé Nast, among others.
NewsWhip
 NewsWhip
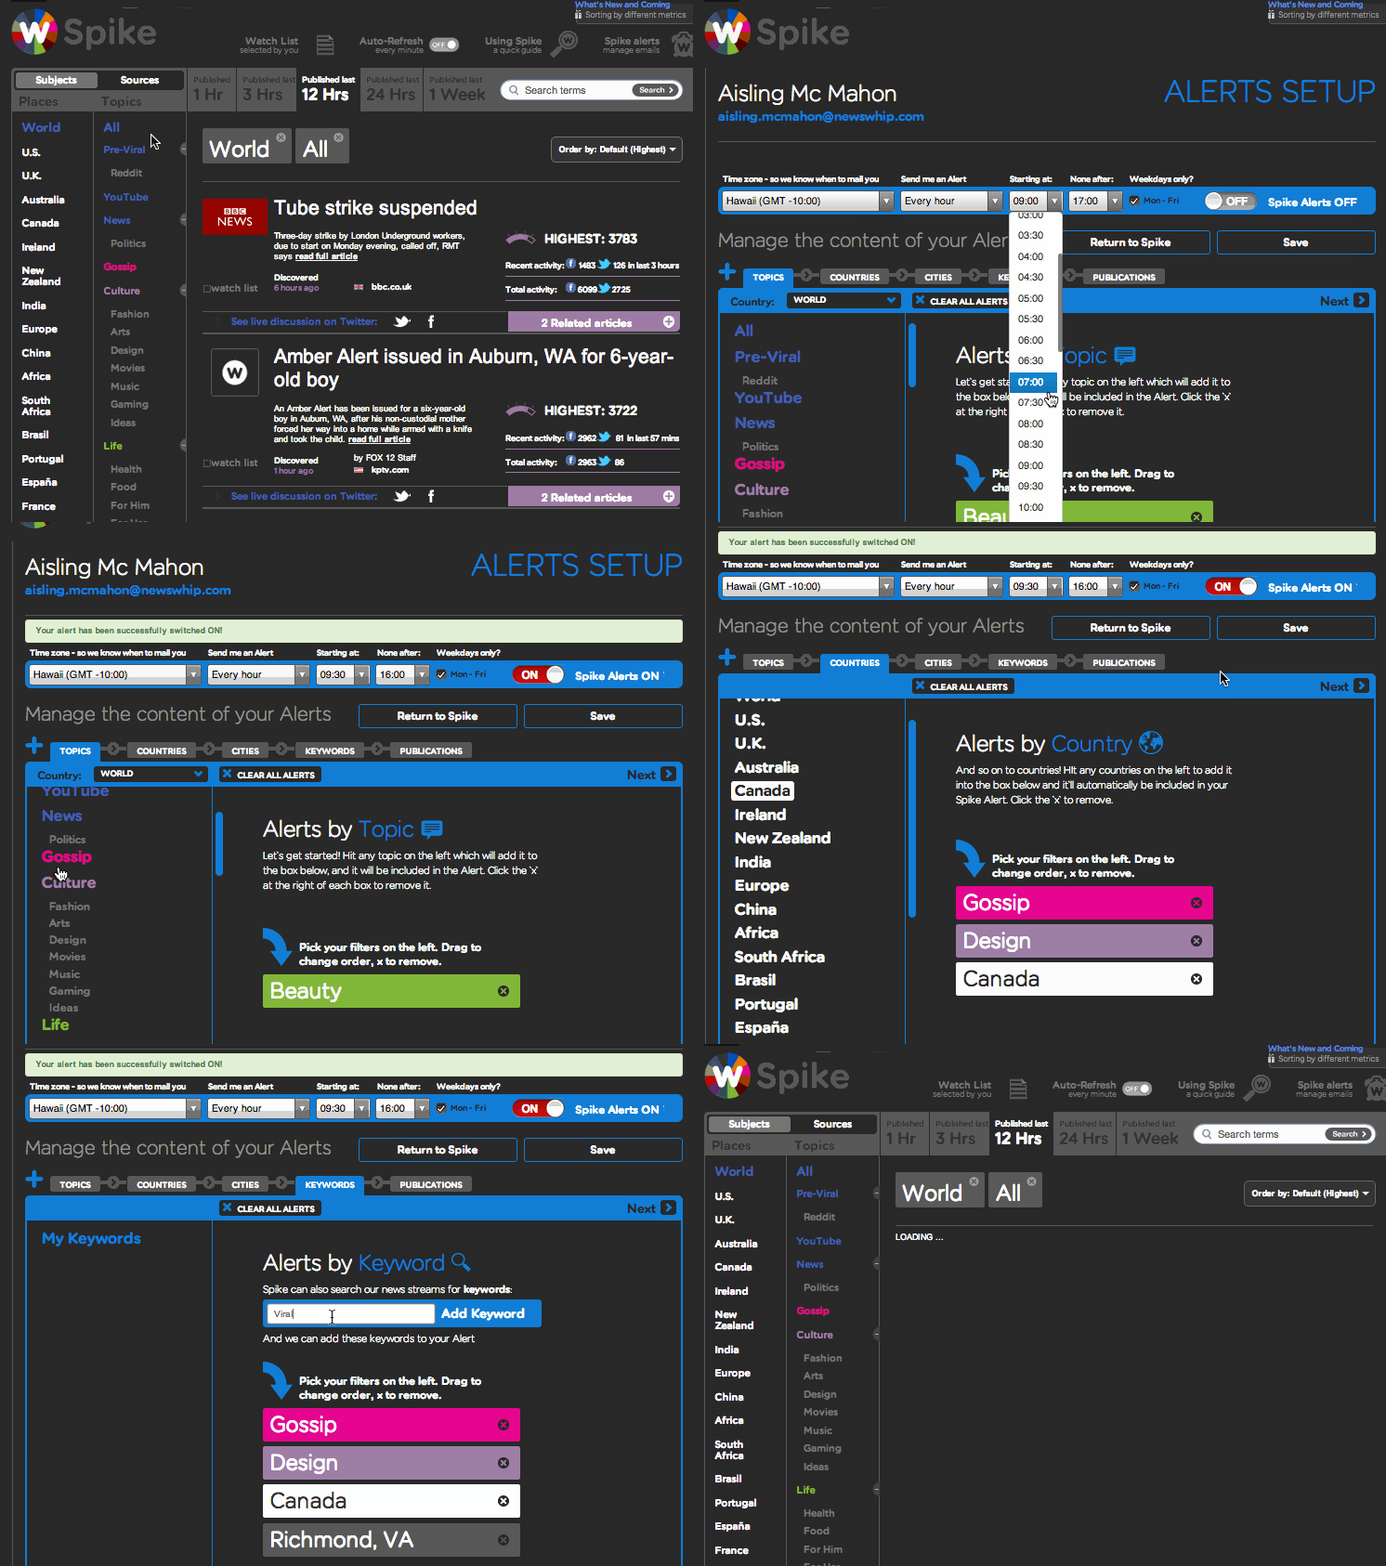
NewsWhip monitors global news trends, enables discovery of pre-viral or viral stories and analyzes content’s performance on social media. It is used by The Associated Press, The Washington Post, MTV, Condé Nast and Time Inc., among others.
Why is this important?
There’s no one-size-fits-all analytics strategy, so publishers need to find which metrics are most important for their editorial and business goals.Killer links
- The Tow Center The traffic factories
- BuzzFeed How BuzzFeed thinks about data, and some charts, too
- Columbia Journalism Review When metrics drive newsroom culture
- Nieman Journalism Lab Think audiences, not just metrics
- Taylor & Francis Online Al Jazeera English online
- Nieman Journalism Lab The FT is launching a new analytics tool
- Nieman Journalism Lab How NPR is trying to expand its digital thinking
- Reuters Institute for the Study of Journalism How news media are developing and using audience data and metrics
People to follow
-
 Melody Kramer is the senior audience development manager at the Wikimedia Foundation.
 -
 Dao Nguyen is the publisher of BuzzFeed.
 -
 Graham Tackley is the co-founder and CTO of Kaleida Networks.
 -
 Caitlin Petre is a resident fellow at Yale's Information Society Project.
Glossary
Number of visitors to a page who follow a link to another webpage, such as when a user goes from one story to the next related article.
Number of visitors who take a desired action, such as signing up for a newsletter or becoming a member.
Amount of time a user spends actively interacting with a page.
Traffic that comes from external sources like social referrals, search or links from other sites.
When analytics tools can’t determine the referrer (email).
Number of times content has been shared via social media, including interactions (likes and mentions).
